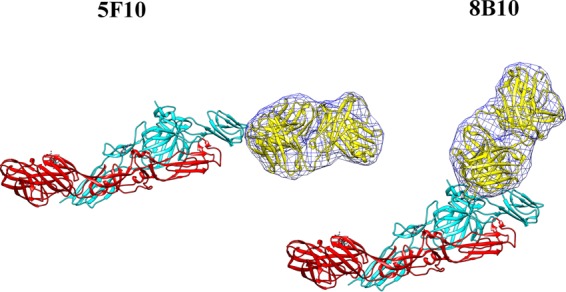
FIG 3.

Fit of the Fab structures (yellow) into the cryo-EM density difference maps (blue mesh) that were calculated by performing a complete three-dimensional orientational search and a limited three-dimensional positional search using the program EMfit. The E1 glycoprotein is colored in red, and E2 is colored cyan.
