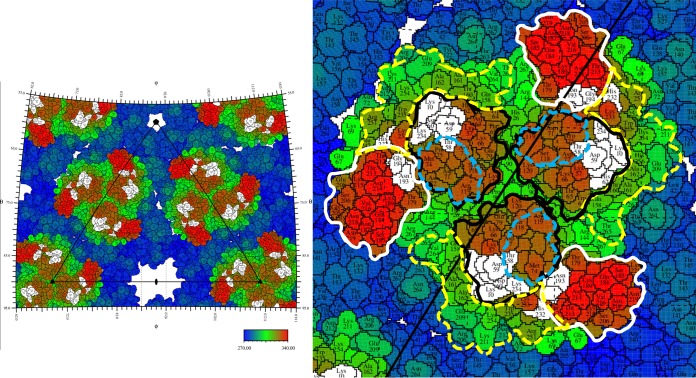
FIG 4.
Stereographic projection showing a roadmap of CHIK-VLP with Fab 8B10 binding sites. The right-hand panel is a close-up of the leftmost trimeric glycoprotein spike. The amino acid colors represent the distance from the center of the virus as defined by the color scale bar. Domains A and B and the β-ribbon connector are bounded by black, white, and dashed yellow lines, respectively. Blue dashes represent the boundaries of the putative receptor-binding region. White-shaded residues represent where the Fab binds on E2. Positions on the surface of the virus can be identified by their latitude and longitude as is usual for locations on Earth. The edges of the left-hand figure correspond to lines of latitude and longitude.

