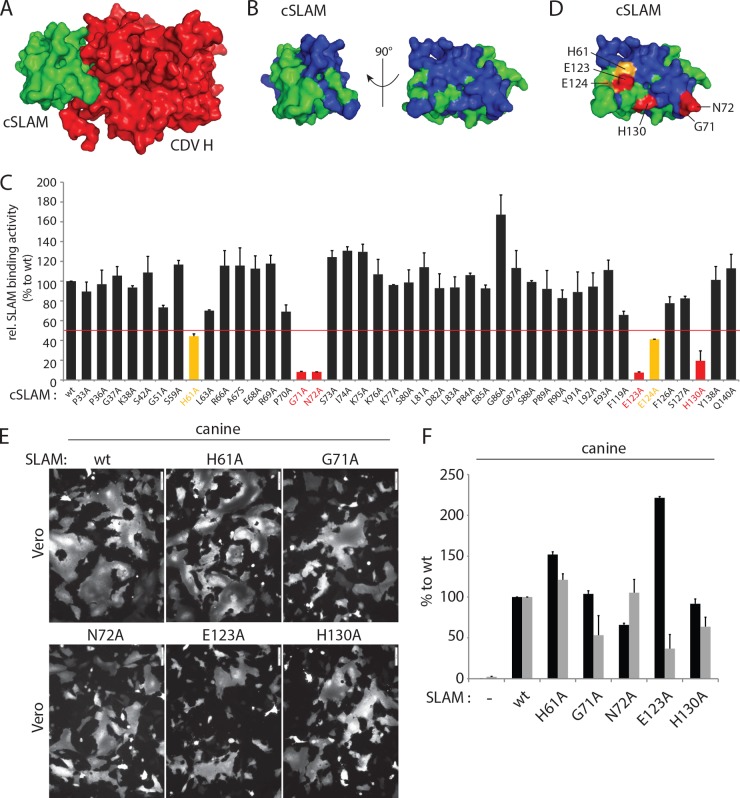
FIG 1.
Identification of key regulatory residues in the front H-binding site of the V domain of canine SLAM. (A, B, and D) Structural homology model of the canine SLAM V domain in complex with one CDV H head or alone (52). (A) The canine SLAM (cSLAM) V domain is color coded in green, and the H protein in red. (B) All residues targeted for alanine-scanning mutagenesis are highlighted in blue. (D) Color coding identifies the residues whose mutation to alanine had a moderate (yellow) or strong (red) effect on the binding activity to CDV H. (C) Results of the semiquantitative CDV H-cSLAM binding assay. Vero cells were transfected with wt SLAM or one of its mutants (HA tagged) and treated 24 h later with the soluble form of CDV H (FLAG tagged). The cells were then stained with an anti-HA MAb and subjected to flow cytometry to record quantitative values. The CDV H-cSLAM binding activities were calculated as the ratios of mean fluorescence intensities obtained with the anti-FLAG MAb (reporting the binding activity of soluble H molecules to each of the membrane-anchored cSLAM variants) normalized to the levels obtained with the anti-HA MAb (reporting the cell surface expression of each of the cSLAM variants). The ratio obtained for the unmodified CDV H-cSLAM combination was arbitrarily set at 100%. Orange and red bars indicate interactions between CDV H and the selected cSLAM variant of less than 50% or less than 20%, respectively. (E) Results of qualitative syncytium formation assays in Vero cells triggered by coexpression of CDV H (strain A75/17), CDV F (strain A75/17), and cSLAM or a cSLAM mutant. To improve the sensitivity of the assay, the cells were additionally transfected with a plasmid encoding the red fluorescent protein. Images of fluorescence emissions from induced cell-cell fusion in representative fields are shown. The pictures were taken 24 h posttransfection with a confocal microscope (Fluoroview FV1000; Olympus). (F) Dark-gray bars show the results for cell surface expression of cSLAM and its mutants as determined by treating Vero cells at 24 h posttransfection with an anti-HA MAb. After the addition of the secondary antibody, MFI values were recorded by flow cytometry. All values were normalized to the one recorded with the unmodified cSLAM molecule. Means ± standard deviations (SD) of data from three independent experiments performed in triplicate are shown. Light-gray bars show the results of the quantitative cell-cell fusion assay. One population of Vero cells (target cells) were infected with MVA-T7 (MOI of 1) and transfected with DNA plasmids encoding the various SLAM mutants. In parallel, another population of Vero cells (effector cells) was transfected with vectors expressing wt F and wt H and a plasmid containing the luciferase reporter gene under the control of the T7 promoter. At 4 h posttransfection, the effector cells were split (1:2) and seeded into new wells. Fifteen hours later, the target cells were detached and mixed with the effector cells. After 5 h at 37°C, fusion was quantified indirectly by using a commercial luciferase-measuring kit. For each experiment, the value obtained for the unmodified F and H combination was set to 100%. Means ± SD of data from three independent experiments performed in duplicate are shown.

