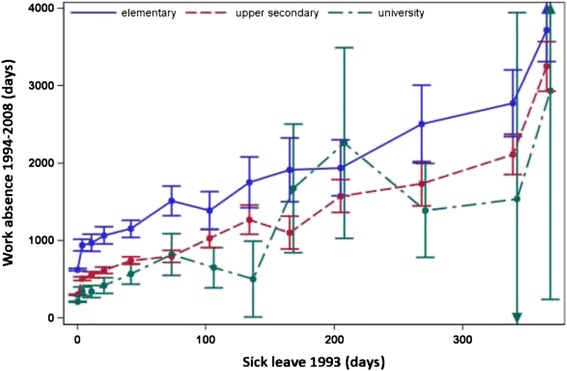
Fig. 3.

Accumulated days of sick leave in 1993 and later work absence 1994–2008, by education Relation between accumulated days of sick leave in 1993 and mean number of days of work absence during 1994–2008, by educational level, with 95 % confidence intervals (CIs) shown. The points in the graph refer to 0, 1–7, 8–14, 15–28, 29–59, 60–89, 90–119, 120–149, 150–179, 180–239, 240–299, 300–364 and 365 days of sick leave taken in 1993
