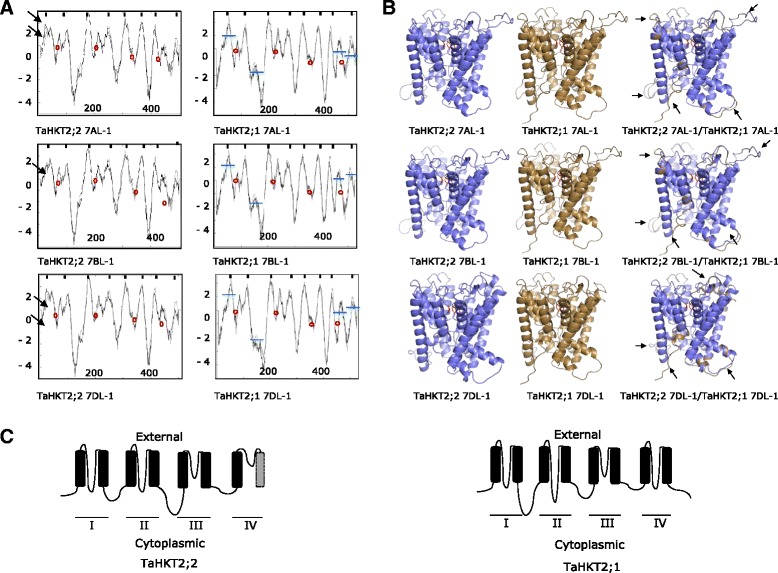
Fig. 2.

Predictions of transmembrane domains (TM) in proteins encoded by TaHKT2;2 and TaHKT2;1 genes. a Hydrophobicity plots of proteins encoded by each member of the TaHKT2;2 and TaHKT2;1 multigene families. The horizontal axis represents amino acid position and the vertical axis represents hydrophobicity value. TMs are indicated as black boxes on top of each graph. The region of the glycine filter domains are circled in red. Physical differences in the N-terminus shown by peak variation are indicated by black arrows. Differences in peak structures TaHKT2;1 relative to TaHKT2;2 proteins are indicated by horizontal blue lines. b The 3-D protein models of individual proteins encoded by TaHKT2;1 and TaHKT2;2 families and superimposed 3-D models of predicted proteins encoded by members of TaHKT2;2 and TaHKT2;1 from the same chromosome. Black arrows on the superimposed 3-D models represent different folding domains between proteins encoded by TaHKT2;1 and TaHKT2;2 counterparts on each chromosome. Conserved filter glycines are indicated in red. c Schematic diagram of the general model predicting protein topology deduced from proteins encoded by TaHKT2;2 and TaHKT2;1 genes. Black filled rectangles represent TMs and the lines cytoplasmic, external and P-loop domains. Putative TM (hydrophobicity value <0) is indicated by grey rectangle
