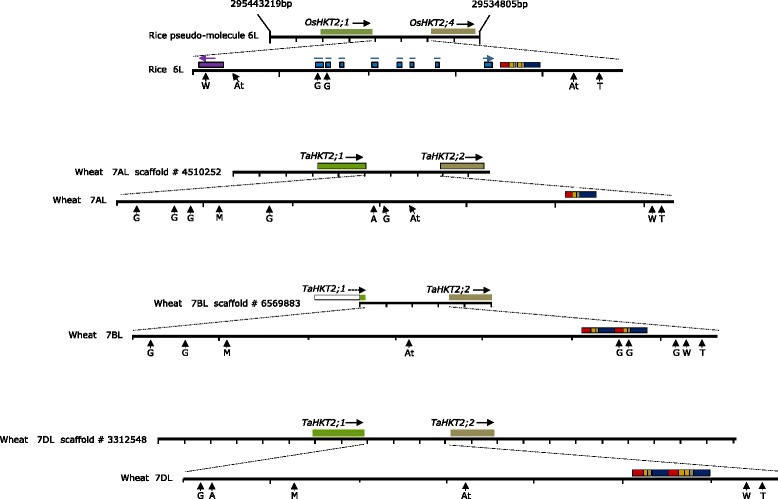
Fig. 5.

Comparative physical map of OsHKT2;1 - OsHKT2;4 intergenic region on rice chromosome 6L and TaHKT2;1 - TaHKT2;2 intergenic region on wheat chromosomes 7AL, 7BL and 7DL. Sequence is represented by chromosome region from pseudomolecule of rice chromosome 6L and scaffold sequences from wheat chromosomes 7AL, 7BL and 7DL where the scale intervals represents 1 kb. The direction of gene transcription is shown by black arrows. The intergenic region is expanded below each sequence or scaffold where scale intervals represent 500 base pairs. Tandem repeat units to the right of each expanded intergenic region are indicated by coloured boxes where each colour represents an individual repeat motif. PIF/ Harbinger type MITE elements are shown in purple whereas remnants of a CACTA type transposon “DTC_Isidor” are indicated in blue boxes. Salt induced cis-acting elements and other regulatory motifs identified on the OsHKT2;4 and TaHKT2;2 promoter regions are indicated by arrows, including ABRE (A), AtMYC2 (At), MYCATERD1 (M), GT-1 box (G), W-box (W) and TATA box (T)
