Fig. 2.

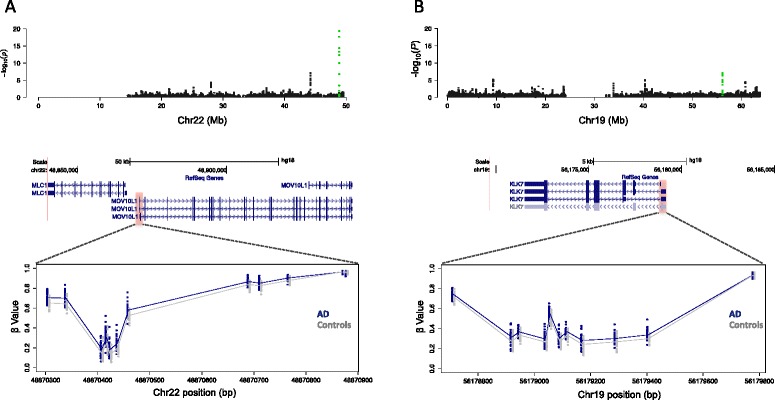
Neighboring CpGs within significant differentially methylated regions (DMRs) exhibit consistent between-group differences in DNA methylation. Zoomed -log10 P-value plots for chromosome 22 (a, upper panel) and chromosome 19 (b, upper panel). The positions of significant DMRs corresponding to plotted green points in (a) and (b) are shown in the context of RefSeq gene annotations (hg18) for promoter regions of MOV10L1 (a, middle panel) and KLK7 (b, middle panel). The approximate positions of each DMR are indicated by red shaded boxes. Detailed images for each locus (lower panels) showing individual CpG β-values, with Alzheimer’s disease (AD) samples shown in blue and control samples in gray. The AD and control group mean β-values are indicated by solid blue and gray lines, respectively. Mb megabase
