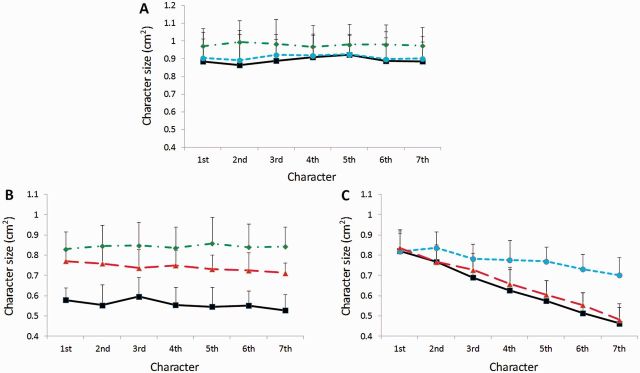
Figure 1.
Character size in each group. Mean character size (from the first to the seventh character) in the control subjects (A), Parkinson’s disease patients with consistent micrographia (B), and Parkinson’s disease patients with progressive micrographia (C) in each writing condition during functional MRI scanning. Values are shown as mean and SD. Black line = the free writing condition; green line = the attention on size condition; blue line = the attention on consistency condition; red line = the free writing ON condition.

