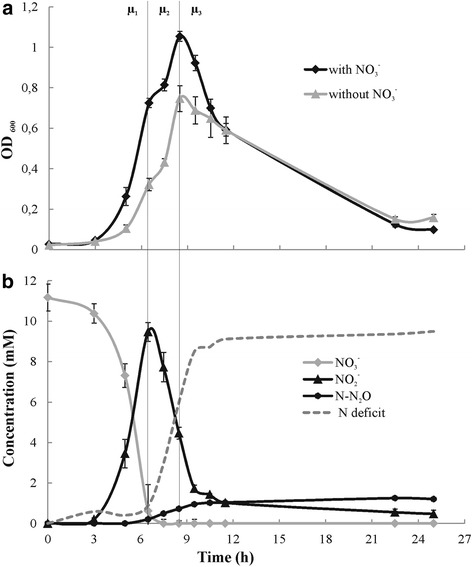
Fig. 1.

Anaerobic growth (OD600) of B. licheniformis LMG 6934 in TSB (a) and nitrate, nitrite and N2O concentrations (mM)(b) over time. Error bars show standard deviation (n = 3). Different growth phases based on primary metabolism in TSB amended with nitrate are marked: μ1, respiratory growth with nitrate as electron acceptor; μ2, fermentative growth after nitrate is depleted; μ3, sporulation. Dashed curve visualizes N deficit caused by the lack of ammonium data
