
Fig. 5.
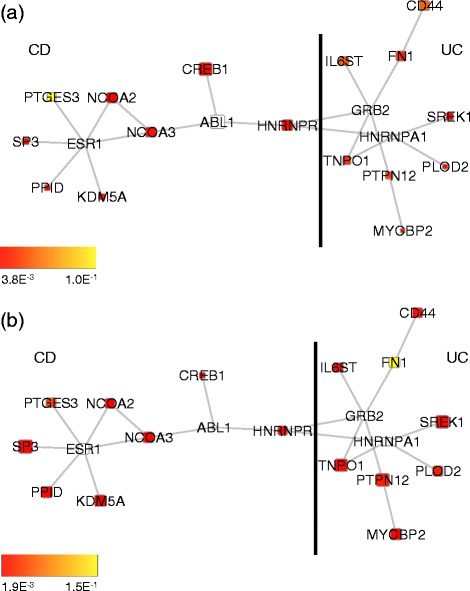
Best non-overlapping modules found in unaffected tissues (size 1 0). Best non-overlapping modules found after 30 optimisation runs among subnetworks of size 10 and with differential expression evaluated on unaffected tissues. The modules are differentially expressed either in CD or UC. The black line indicates the boundary between nodes associated with CD and nodes associated with UC. Node colour is proportional to the node p-value in CD (a) and UC (b). Node size is proportional to its identification frequency when applying our evolutionary algorithm by varying network size (see section Results and discussion in the main text)