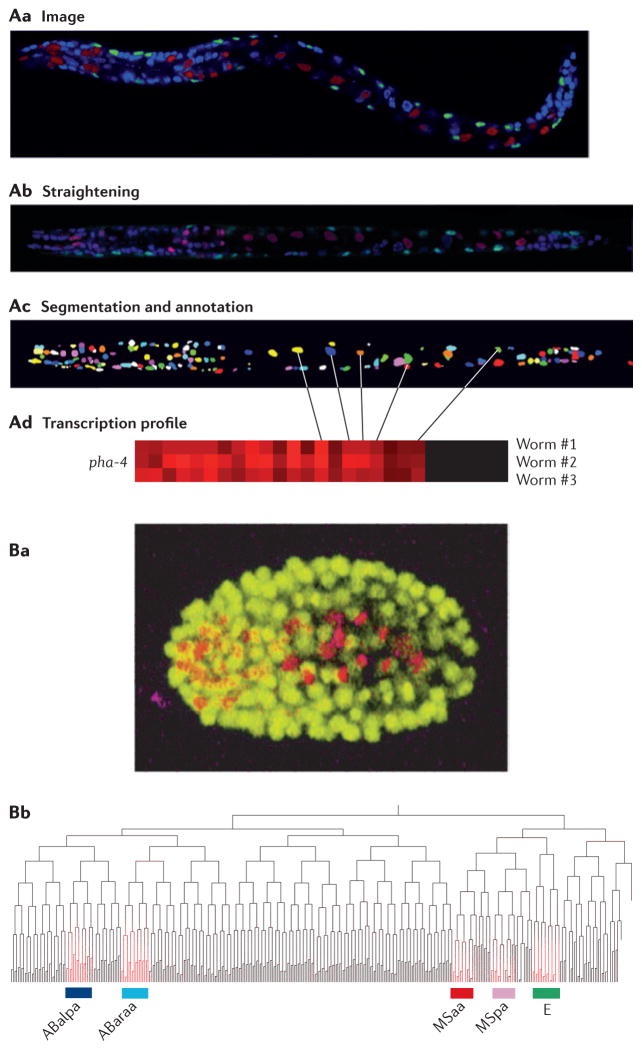
Figure 3. Using imaging in Caenorhabditis elegans to study cell lineages.
A | Generating an expression profile from a three-dimensional confocal image stack. First, confocal images are generated from transgenic worms expressing cherry fluorescent protein from a promoter of interest (red) and GFP in muscle cells from the myo-3 promoter (green) and in which nuclei are stained with 4′,6-diamidino-2-phenylindole (DAPI) (blue) (Aa). The images are then computationally straightened and DAPI-stained nuclei are identified (Ab). Finally, individual nuclei (pseudocoloured for visualization) are identified (Ac) and expression is quantified (Ad). B | Generating a lineage-specific expression profile from time-lapse images. Transgenic worms expressing both GFP from the histone promoter to mark all nuclei (yellow) and cherry fluorescent protein from a promoter of interest are imaged continuously throughout embryogenesis (Ba). The time and place of expression for a gene of interest can be mapped onto the defined C. elegans lineage tree (Bb). In this example, the gene of interest (highlighted in red) is expressed in the ABalpa, ABaraa, MSaa and MSpa developmental lineages, which comprise most of the cells in the pharynx, as well as the E lineage, which comprises intestinal cells. Part A is reproduced, with permission, from REF. 44 © (2009) Cell Press. Part B is reproduced, with permission, from REF. 46 © (2008) Macmillan Publishers Ltd. All rights reserved.

