Fig. 1.

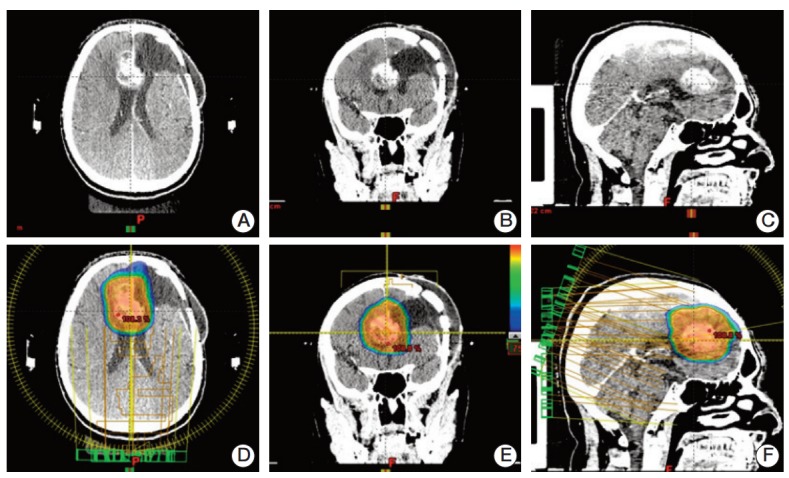
Three views of the computed tomography scan showing the recurrence site (A-C) and dose distribution from the volumetric modulated arc therapy plan (D-F) for one patient.

Three views of the computed tomography scan showing the recurrence site (A-C) and dose distribution from the volumetric modulated arc therapy plan (D-F) for one patient.