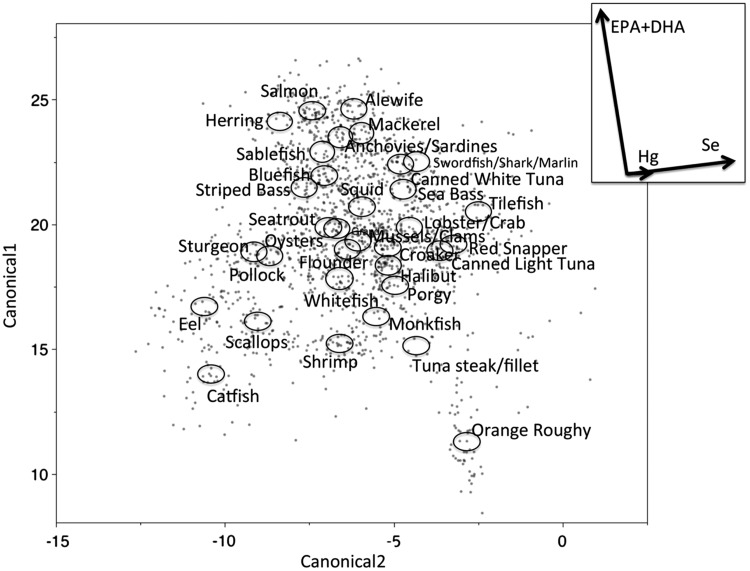
Fig. 3.
Canonical discriminant analyses testing for differences in mercury-nutrient signatures among seafood items (from Karimi et al., 2014, reprinted with permission). Circles indicate 95% confidence limits for means of each seafood group and indicate the degree of difference among groups. Mercury and nutrient vectors (inset) represent the underlying structure of the axes. The position of circles relative to the direction of vectors indicates correlations between seafood groups and the concentration gradient of mercury or nutrients. Vector length indicates the overall contribution of mercury or nutrients in discriminating among seafood groups. Vector direction indicates the correlation of mercury or nutrient with each axis (vectors parallel to an axis are highly correlated with that axis). Angles between vectors represent correlations among mercury and nutrient concentrations. EPA, eicosapentaenoic acid; DHA, docosahexaenoic acid; Hg, mercury; Se, selenium.

