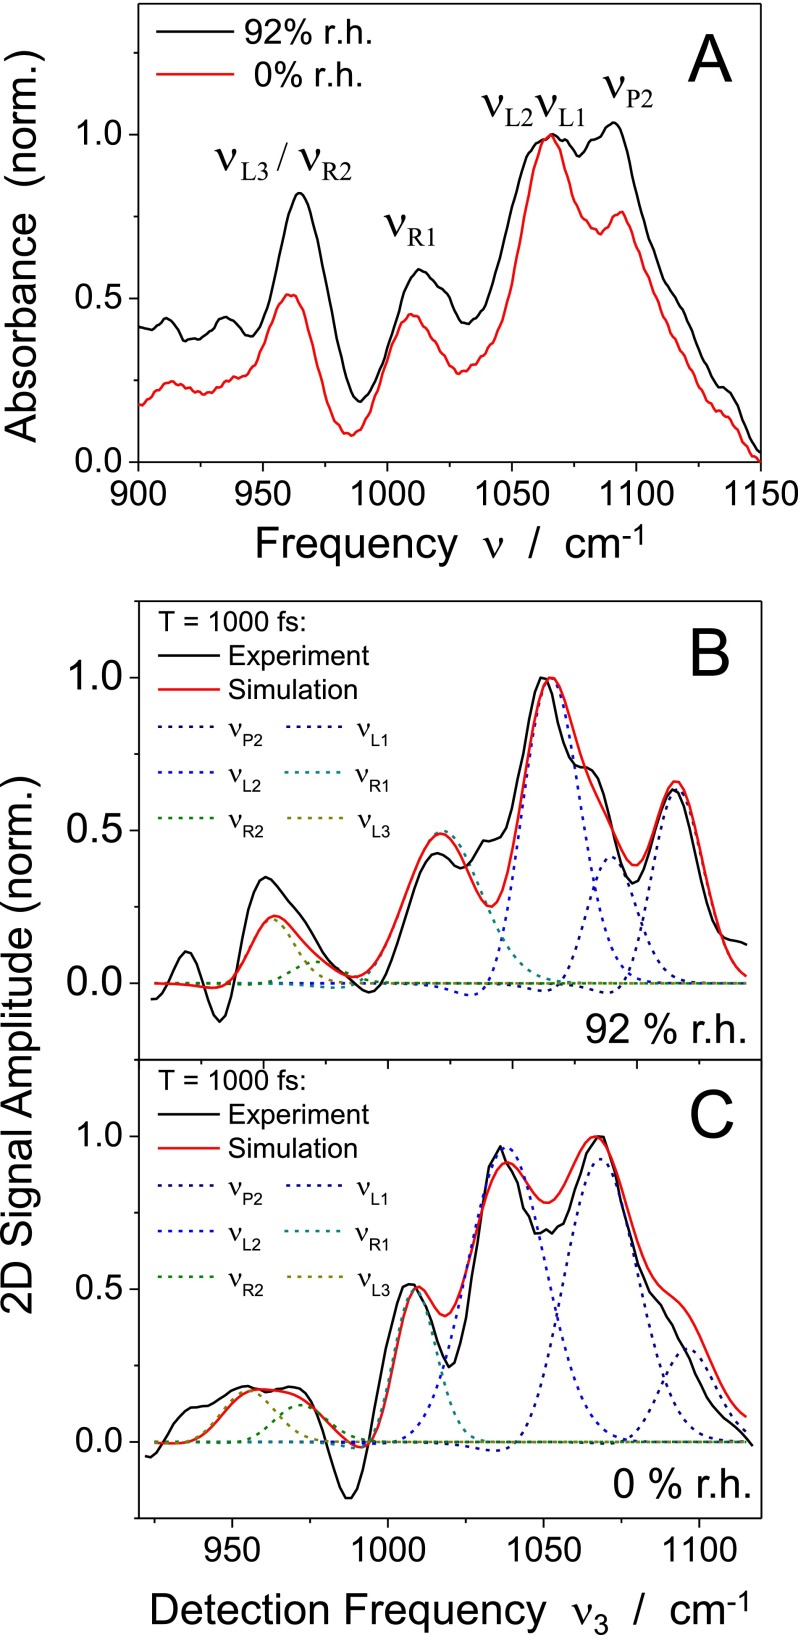
FIG. 2.
(a) Infrared absorption spectra of the DNA oligomers at hydration levels of 0% r.h. and 92% r.h. The spectra are normalized to the absorbance at 1065 cm−1. The different backbone modes delocalized over the phosphate (), ester linkage (), and furanose ring () are listed in Table I. (b) Cross section along the diagonal of the 2D spectrum in Fig. 3(a) (black line, 92% r.h.). The experimental result is compared to the calculated cross section (red line) representing the sum of the contributions of the individual backbone modes (dashed colored lines). (c) Same for the 2D spectrum in Fig. 3(c) (0% r.h.).

