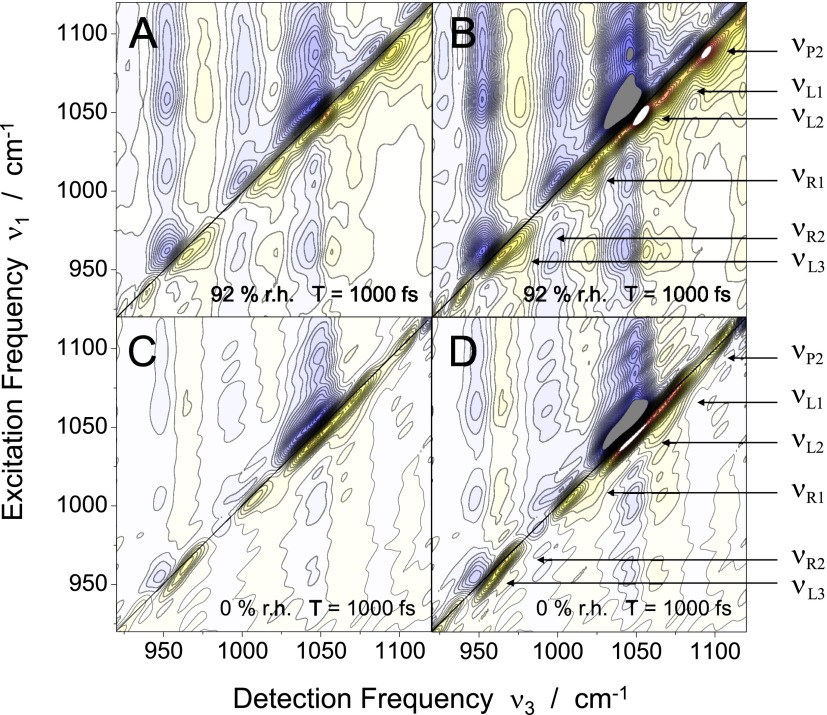
FIG. 3.
2D spectra of the DNA oligomers at (a) 92% r.h. and (c) 0% r.h. The spectra were recorded at a population time of T = 1000 fs. Positive and negative signals are plotted as yellow-red and blue contours, respectively. The signals are normalized to their maximum values, the amplitude changes by 5% between neighboring contours lines. (b) and (d) display the same spectra normalized to half of the maximum in the absolute signal level for comparison of the low-contrast features.

