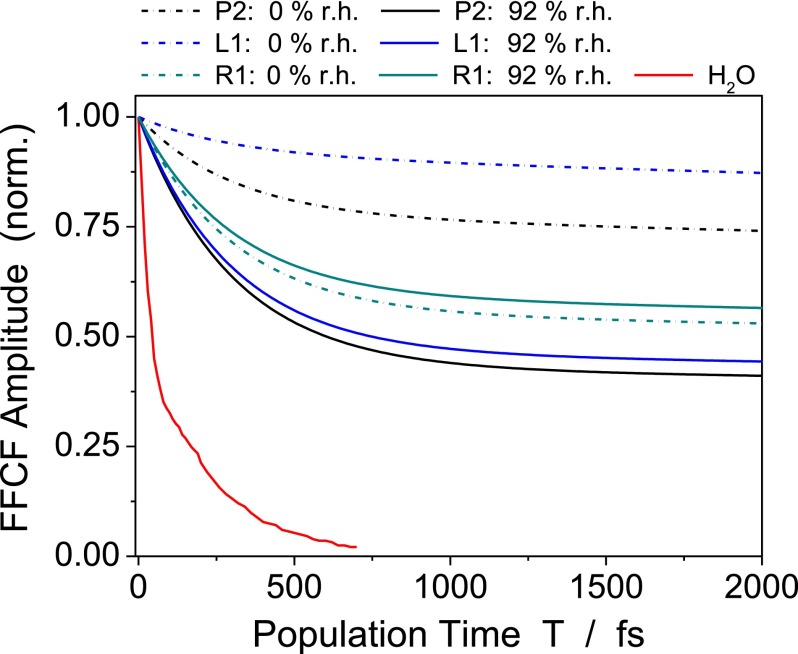
FIG. 6.
Frequency fluctuation correlation functions of three selected modes as determined from the 2D lineshapes of the signals along the frequency diagonal in Fig. 3. The relative strength of the fast 300 fs FFCF components is strongly reduced upon changing the hydration level from 92% r.h. (solid lines) to 0% r.h. (dashed lines). As a benchmark, the FFCF of bulk H2O from Ref. 17 is shown.

