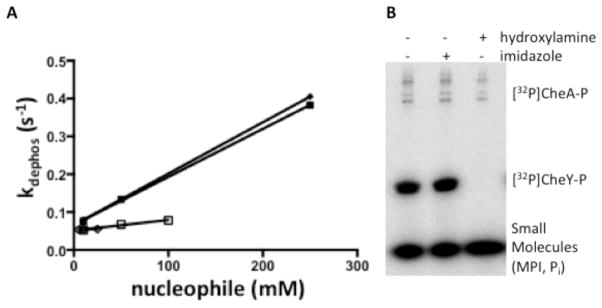
Figure 3.
CheY-P dephosphorylation in the presence of imidazole or hydroxylamine. (A) Plots of kdephos versus small molecule concentration showing the enhancement of CheY-P dephosphorylation with hydroxylamine (open squares and diamonds) compared to imidazole (closed squares and diamonds). CheY dephosphorylation was measured by stopped-flow fluorescence as previously described. The y-intercepts of each fit are approximately the rate constant for water-mediated dephosphorylation. Plots show two individual repeats each for CheY-P measurement with hydroxylamine or imidazole. (B) Phosphorimaging scan showing the loss of 32P from denatured [32P]CheY-P. CheY was phosphorylated using [32P]CheA-P. After a 10 second incubation, SDS was added to denature the proteins. The reaction was separated into three aliquots to which buffer with no nucleophile (lane 1), 250 mM imidazole (lane 2), or 250 mM hydroxylamine (lane 3) were added. After incubating for one hour at room temperature, reaction components were separated by SDS-PAGE, and loss of radiolabel from CheY was detected using a phosphorimager.

