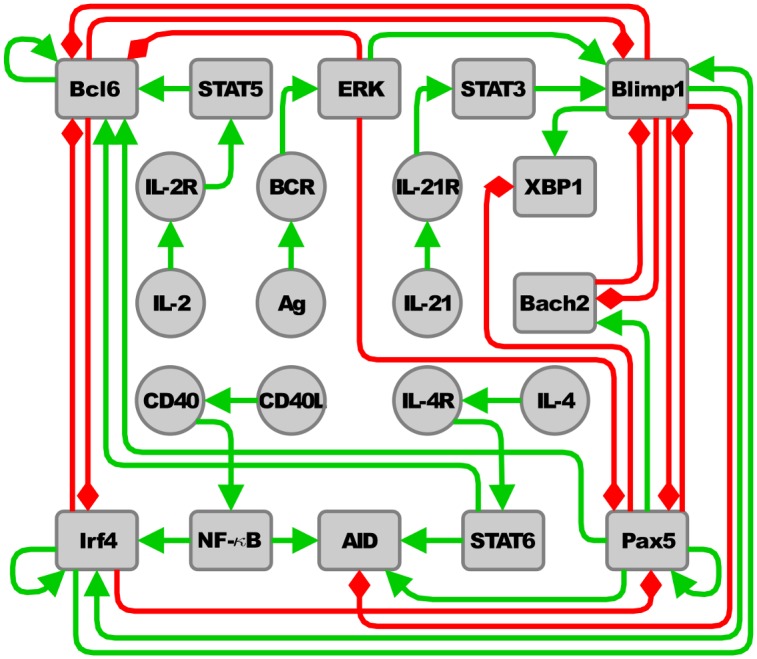
Fig 2. The regulatory network of B cells.

Nodes represent molecules or molecular complexes. Positive and negative regulatory interactions among molecules are represented as green continuous arrows and red blunt arrows respectively.

Nodes represent molecules or molecular complexes. Positive and negative regulatory interactions among molecules are represented as green continuous arrows and red blunt arrows respectively.