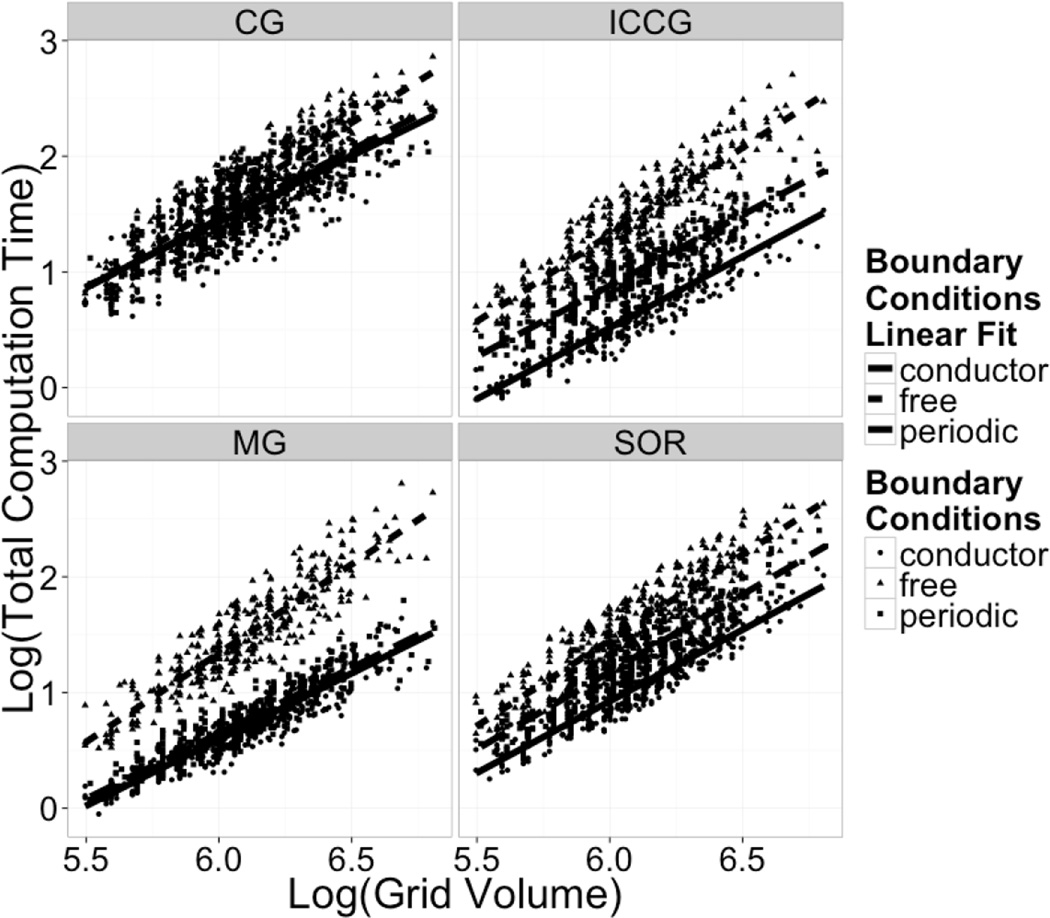
Figure 7. Total PB Time Scaling: Log Computation Time vs Log Grid Volume.
Log-log plots of the total computation time required versus total number of grid points (grid volume). The total computation time includes all time needed for the PB calculations to finish normally, such as boundary potential setup, energy calculation, and molecular surface generation.

