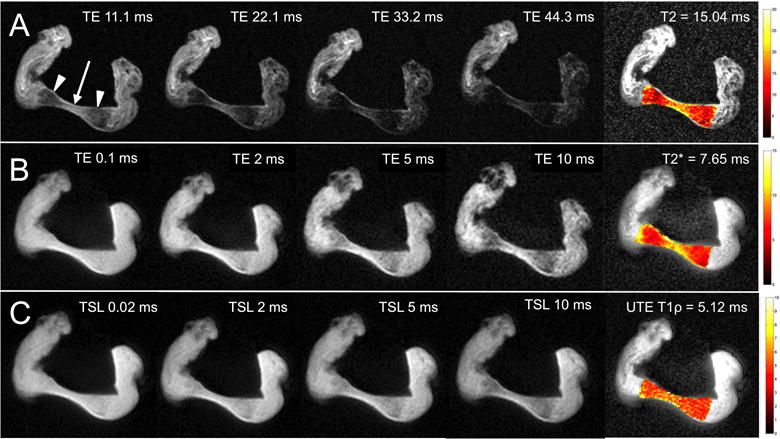
Figure 4.

A. Sagittal T2 SE MR images and color mapping of a cadaveric TMJ articular disc at a series of TEs (11.1, 22.1, 33.2 and 44.3 ms). B. Sagittal UTE T2* MR images and color mapping of the same articular disc at a series of TEs (0.1, 2, 5 and 10 ms). C. Sagittal UTE T1ρ MR images and color mapping of the same articular disc at a series of spin-lock times (TSL) (0.02, 2, 5 and 10 ms). At the anterior and posterior bands of the disc (arrowheads), the signal decays fast with increasing TEs. In contrast, the intermediate zone (arrow) has higher signal intensity with longer TEs. UTE T1ρ MR images show less signal loss with increasing TSLs as compared with the UTE T2* with increasing TEs. T2, UTE T2* and UTE T1ρ values are lower at the anterior and posterior bands of the disc as compared with the intermediate zone. This is reflected in the color maps.
