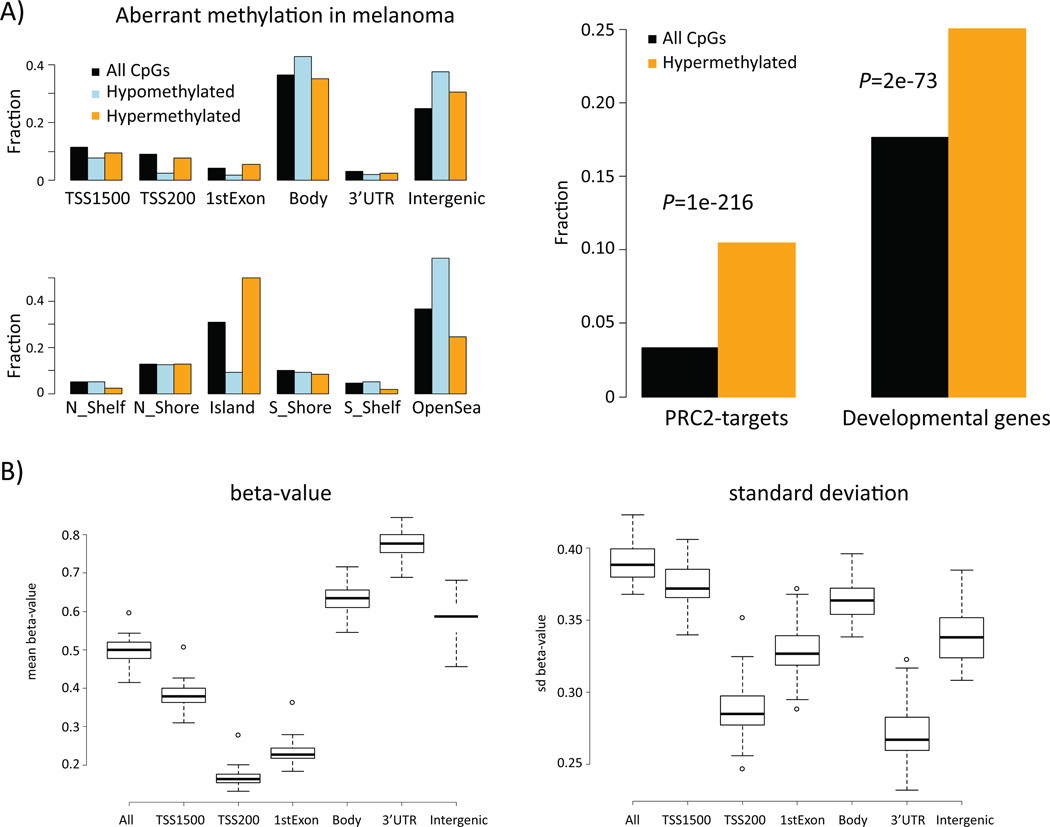
Figure 1.
DNA methylation patterns in melanoma. A) Location of hypomethylated and hypermethylated CpGs as well as all platform CpGs in respect to genes and CpG island annotations (left panel). Functional enrichment of genes that contain hypermethylated CpGs (right panel). For a given set of CpGs (all/hypo-meth./hyper-meth.) a bar indicates the fraction of CpGs assigned to the respective annotation. TSS1500 = 1500 to 201 bp upstream of transcription start, TSS200 = 200bp to transcription start site, Body = gene body. PRC2-targets = set of genes that is targeted by histone H3K27-methylating complex PRC2 (Lee et al., Cell 2006) B) DNA methylation characteristics across 50 melanomas; mean of β-values (left) and standard deviation of β-values (right) along the genes.

