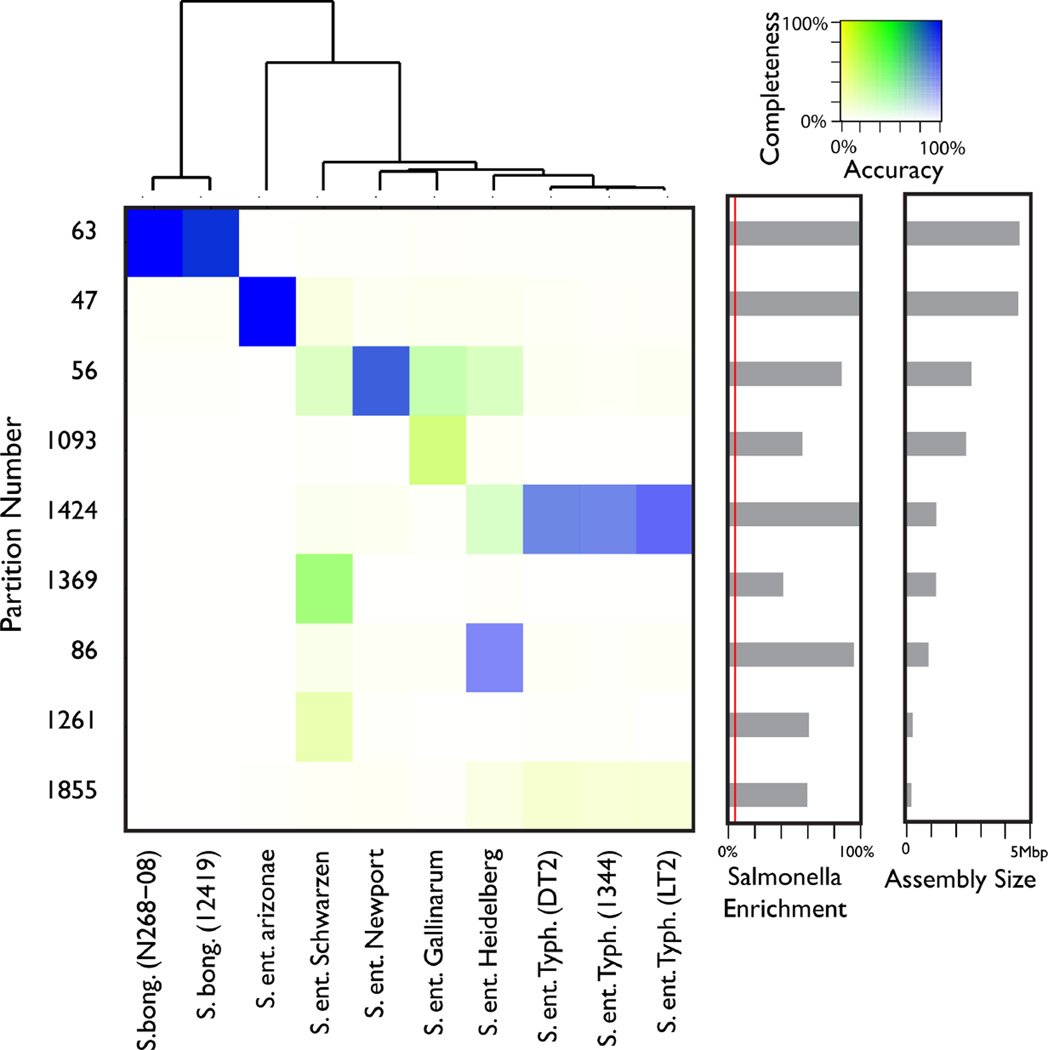
Figure 1.
Accuracy and completeness of recovered genomes. The accuracy of Salmonella enriched partitions (rows) with respect to each strain (columns) is depicted on a color scale. Saturation of each color indicates the completeness of each assembly with respect to each strain. Bars in the two right panels indicate the fraction of reads in a partition coming from any Salmonella strain (red line = 5%; the background abundance of spiked-in Salmonella reads), and the total assembly length. The tree at the top was constructed using MUMi distance between strains.

