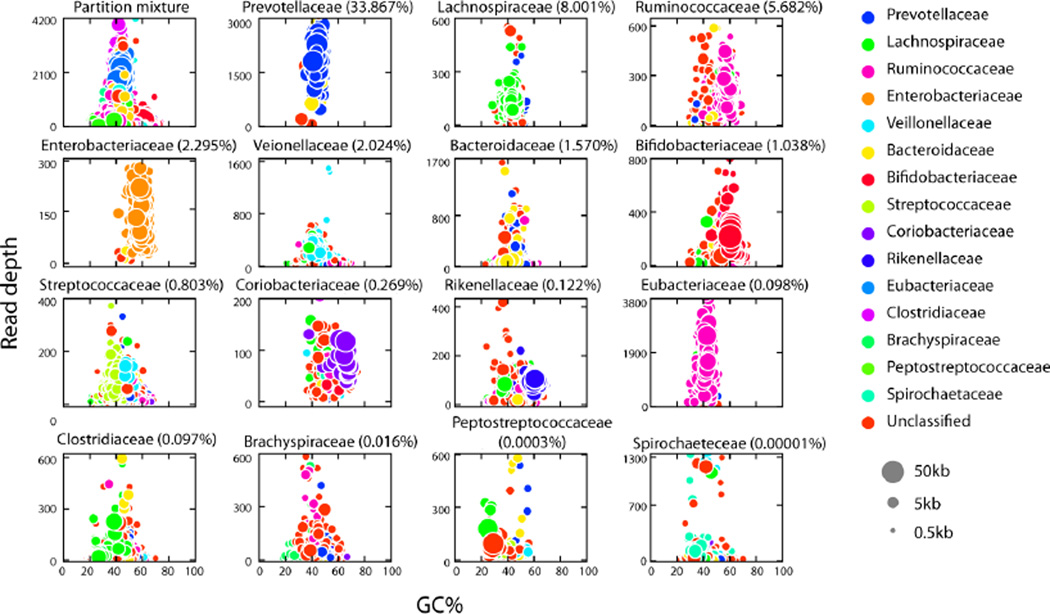
Figure 5.
GC Content versus Contig Depth. Plotted are the GC content (x-axis) and depth (y-axis) for contigs in partitions representing the top 15 enriched families from the FijiCoMP collection. Alignments to different families are depicted in different colors, and the size of each circle represents the length of each contig. For each family the background abundance is indicated in parentheses.

