Figure 1.
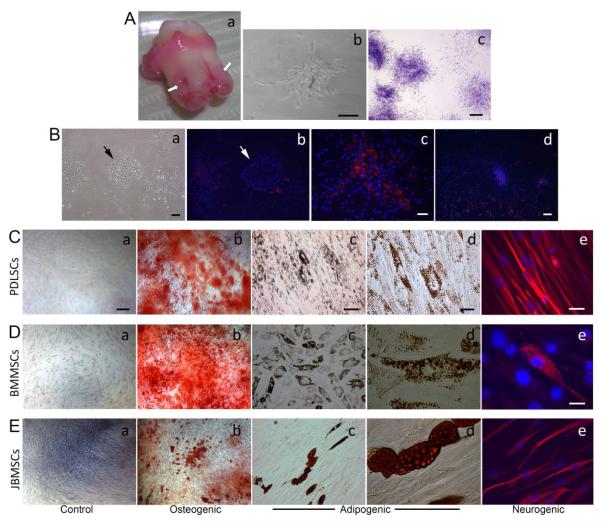
Isolation and characterization of heterogeneous human PDLSCs. (Aa) Image of a freshly extracted third molar. Arrows indicate PDL to be isolated. (Ab) Colony formation after initial seeding (passage 0). (Ac) PDLSC colonies formed at passage 1 fixed and stained with toluidine blue. (Ba) Initial seeding (Passage 0) showing an island of epithelial cells (arrow), a CFU-F (on the left) and scattered single cells. (Bb) STRO-1 staining (red fluorescence) of the culture shown in Ba. Notice the epithelia island is STRO-1 negative. The cell nuclei were stained with DAPI (blue). (Bc) STRO-1 positive in a single PDLSC CFU-F (passage 0). (Bd) STRO-1 positive PDLSC CFU-F and in scattered cells (passage 2). (C-E) Induced differentiation of PDLSCs (C), BMMSCs (D), and JBMSC (E) at passage 2-3. (Ca, Da, Ea) Controlled groups without stimulation; (Cb, Db, Eb) osteogenic induction after ~6 weeks followed by Alizarin Red stain showing mineral deposits; (c & d of C, D, E) adipogenic induction for ~6 weeks followed by Oil-Red stain showing oil droplet-filled adipocyte-like cells; (Ce, De, Ee) neurogenic induction (in NIM-1) for 4 weeks followed by staining of βIII tubulin (red fluorescence). Scale bars: (Ab) 100 μm; (Ac) 1 mm; (Ba, b) 200 μm; (Bc) 100 μm; (a, b of C, D, E) 200 μm; (c of C, D, E) 100 μm; (d of C, d, E) 20 μm; (Ce, Ee) 30 μm; (De) 20 μm.

