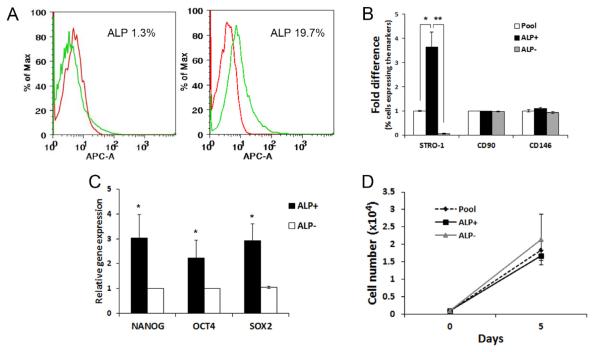
Figure 3.
Characterization of the early passage ALP subpopulation of PDLSCs. (A) Flow cytometry analysis of ALP subpopulation in PDLSCs at passages 2-3. Representative data showing a wide variation of percentages of the ALP+ subpopulation, with as little as 1.3% or up to 19.7%. (B) Flow cytometry analysis of the quadruple staining of STRO-1, CD90, CD146 and ALP showing the levels of STRO-1+, CD90+ and CD146+ cells within the subpopulations of sorted ALP+ and ALP− compared to the percentage of those markers in the original entire population (pool). (One-way ANOVA was performed to compare the means percentage among three populations. Tukey HSD was used to determine the pair difference. Significantly different, p<0.05*; p<0.0001**; n=6). Original expression levels in percentage presented in supplemental Table II. Cells analyzed at passages 1-3. (C) Stemness gene expression level between ALP+ and ALP− subpopulations. (Based on 4 independent experiments each from a different donor and tested in triplicate). (Significantly different between each ALP+/ALP− pair, p<0.05*. The subpopulation effect for each gene was tested using a mixed-effects model.) (D) Growth rate of the pool, ALP+ and ALP− PDLSCs. Cells were seeded at 0.1 × 10⁴ per well of 12-well plates in triplicate on day 0 and harvested/counted on day 5. Data based on 3 independent experiments (3 different donors), each assayed in duplicate. No significant difference was found among the subpopulation groups using a mixed-effects model (p = 0.42).

