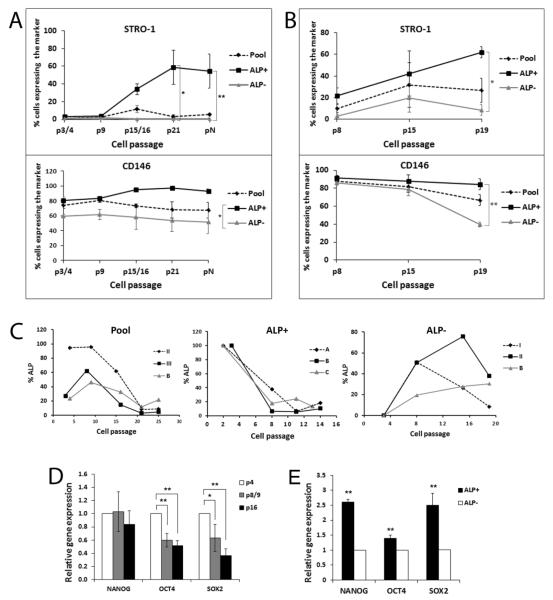
Figure 5.
Expression of stemness genes by subpopulations of PDLSCs at higher passages. (A) PDLSC original pool was continuously cultured and passaged (1:3 ratio/dilution) at subconfluence and subjected to flow cytometry analysis following quadruple staining of STRO-1, CD90. CD146 and ALP. The expression of STRO-1 and CD146 of the pool and subpopulations at different passages was plotted. pN, at the cell passage axis indicates that cells were passaged at passage 8 with 1:15 ratio/dilution and continued to passage in this manner until reaching passage 16 (counting from passage 8). p3/4 or p15/16 denotes that cells were analyzed either at passage 3 or 4, or passage 15 or 16, respectively. Data represent mean ± SEM of cells from three different donors. (B) PDLSC ALP− subpopulation was sorted from original pool PDLSCs at passage 3 and were continuously cultured and passaged (1:3 ratio/dilution) at subconfluence and subjected to flow cytometry analysis with the same approach as for (A). Data represent mean ± SEM of cells from three different donors. (C) PDLSC original pools, ALP+ subpopulation, and ALP− subpopulation were continuously passaged (1:3 ratio/dilution) and subjected to flow cytometry analysis to detect the percentages of the cells expressing ALP. Each graph presents data of cells from three different donors (A, B, C, I, II, II are donor codes). ALP+ subpopulation was isolated at passages 2-3 and the ALP levels were considered as 100% right after sorting. ALP− subpopulation was isolated at passage 3 and considered as 0% ALP right after sorting. (D) Expression of stemness associated genes NANOG, OCT4 and SOX2 by PDLSC pools at various passages detected by qPCR (Data represent mean ± SEM from three different donors each assayed in triplicate). (E) Expression of stemness associated genes NANOG, OCT4 and SOX2 by PDLSC subpopulations ALP+ and ALP− at passage 8. PDLSC pools were first sorted at passages 2-3 and the ALP− subpopulation was continuously cultured and passaged until passage 8 and sorted again to separate ALP+ and ALP− for qPCR analysis. (Data represent mean ± SEM from two different donors each assayed in triplicate.) A mixed-effects model with repeated measures was performed for each gene in (A), (B), and (D) with Tukey HSD post-hoc analysis. A mixed effect model was used to test the subpopulation effect on the expression of each gene in randomly selected patients (E). (Significantly different, p<0.05*; p<0.0001**).

