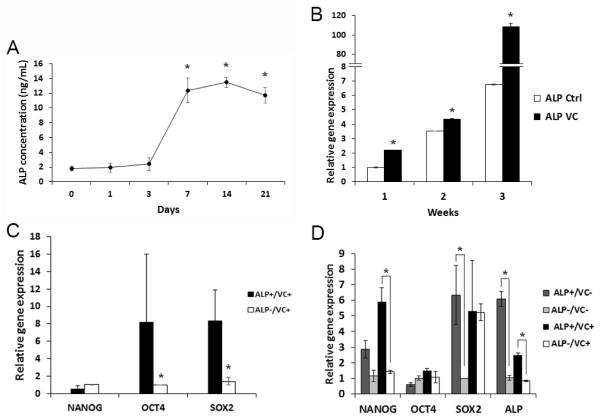
Figure 6.
ALP+ PDLSCs after confluence and vitamin C treatment. (A) PDLSCs at passages 2-4 were seeded into wells of 6-well plates and allowed to grow confluent for up to 21 days. At different time points, cells were subjected to ALP assay. Data represent mean ± SEM from three different donors each assayed in triplicate. A mixed effect model was used to test the effect of time on protein levels. All pairwise comparisons were done and p-values were adjusted using the Tukey method. (Significantly different, p≤0.0001*). (B) PDLSCs at passage 3 were seeded in wells of 6 well-plates and vitamin C (VC) at 20 μg/mL was added to experimental group at ~80% subconfluence. At different time points, cells were harvested and subjected to qPCR detection of ALP expression. Data represent one donor assayed in triplicate. Two sample t-tests were used and p-values were adjusted using Bonferroni method. (Significantly different, p<0.0001*). (C) PDLSCs were cultured with VC for 1 week and sorted into ALP+ and ALP− cells for RNA isolation and qPCR analysis of the stemness gene expression. Data represent mean ± SEM from three different donors each assayed in triplicate. (The qPCR data values were very low in these cells and some of them were below detectable levels). A mixed effect model was used to test the subpopulation effect on the expression of each gene in randomly selected donors. The p-values were adjusted using the Benjamini-Hochberg procedure. (Significantly different, p=0.045*). (D) PDLSCs were cultured with or without VC for 3 weeks and cells were sorted into ALP+ and ALP− cells for RNA isolation and qPCR analysis. Data represent one donor assayed in triplicate. (Significantly different, p≤0.05*). (70-99% of cells were ALP+ after sorting in C, D). PDLSCs were grown in medium absent of L-ascorbic acid 2-phospate for the VC experiments. A linear model with subpopulation as the main effect (ALP+ and ALP−) was used for each gene with or without VC. P-values were adjusted using the false discovery rate procedure.

