Figure 1.
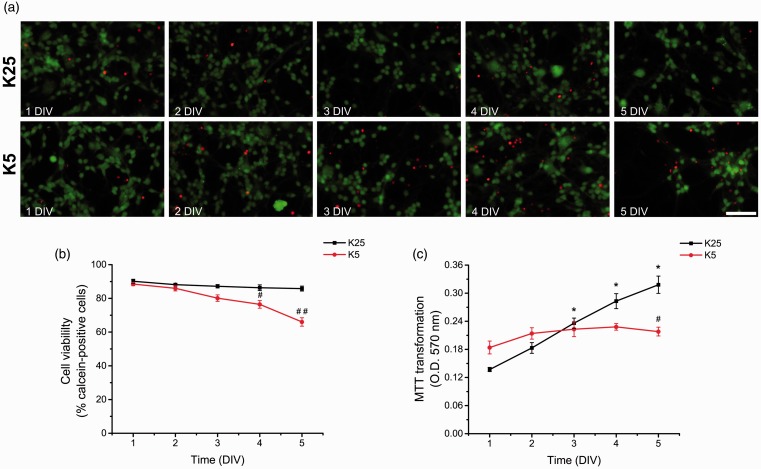
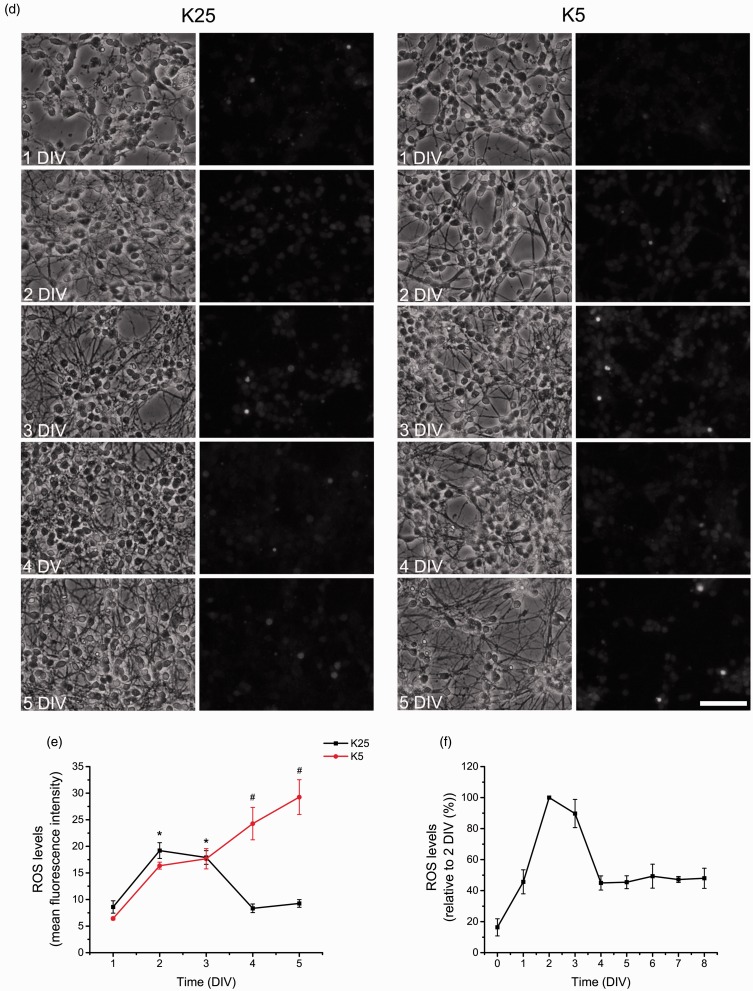
ROS are differentially produced during CGN development. (a) Representative micrographs of CGN grown in depolarizing conditions (K25) and nondepolarizing conditions (K5) from 1 to 5 DIV. Calcein-positive cells are marked in green, and propidium iodide-positive cells are marked in red (scale bar, 100 µm). (b) Cell viability is expressed as the percentage of calcein-positive cells from the total number of cells, which was estimated as the sum of calcein-positive cells plus propidium iodide-positive cells. #, ## are significantly different from K25 at 4 and 5 DIV (p < .01, p < .001, ANOVA, n = 6). Data are mean ± SEM. (c) Metabolic activity was determined by MTT transformation of CGN grown in K25 or K5 from 1 to 5 DIV. *is significantly different from K25 at 1 DIV (p < .001, ANOVA, n = 6). # is significantly different from K25 at 5 DIV (p < .001, ANOVA, n = 6). Data are mean ± SEM. (d) Phase contrast and fluorescence micrographs of CGN grown in K25 or K5 during 1 to 5 DIV (scale bar, 100 µm). (E) ROS levels of CGN grown in K5 or K25 from 1 to 5 DIV. ROS levels are expressed as mean values of the mean fluorescence intensity of ethidium cation, which is the product of the dihydroethidium oxidation. * is significantly different from K25 at 1 DIV (p < .05, ANOVA, n = 4). # is significantly different from K25 at 4 and 5 DIV (#p < .001, ANOVA, n = 4). Data are mean ± SEM. (f) ROS levels of CGN grown in K25 from 0 to 8 DIV. ROS levels produced from 1 to 8 DIV were higher compared to 0 DIV (p < .001, ANOVA, n = 3–9). ROS levels produced at 2 and 3 DIV were higher compared to 0, 1, 4–8 DIV (p < .001, ANOVA, n = 3–9). Data are normalized with respect to 2 DIV and are presented as mean ± SD. DIV = days in vitro; ROS = reactive oxygen species; CGN = cerebellar granule neurons; ANOVA = analysis of variance.


