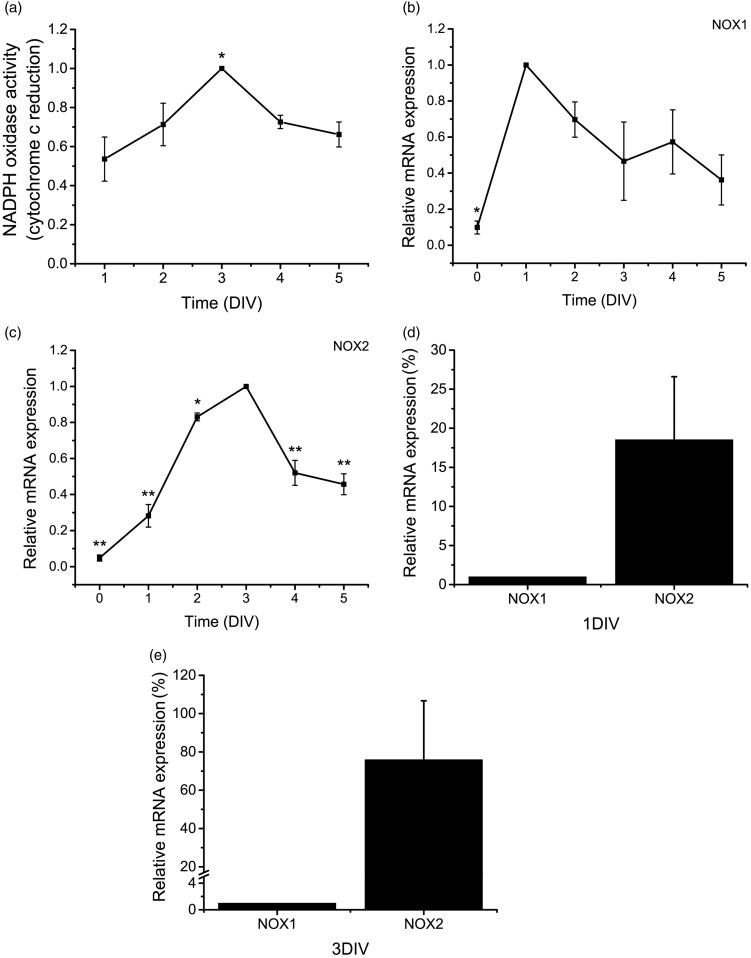
Figure 4.
NOX1 and NOX2 are differentially expressed during CGN development. (a) NOX activity was determined in CGN from 1 to 5 DIV by cytochrome c reduction as detailed in Methods. * is significantly different from 1 DIV (p < .01, ANOVA, n = 5). Data were calculated as nmol min−1 per mg protein and were normalized with respect to 3 DIV and are presented as mean ± SEM. (b to e) Relative mRNA levels of NOX1 and NOX2 were determined in CGN from 0 to 5 DIV by the 2−ΔΔCt method of relative quantification as detailed in Methods. Data were normalized with respect to the time in which the expression reaches its maximum level. (b) * is significantly different from 1 DIV (p < .01, ANOVA, n = 3). Data are mean ± SEM. (c) NOX2 mRNA levels at 0, 1, 2, 4, and 5 DIV were significantly different with respect to 3 DIV (*p < .05, ** p < .001, ANOVA, n = 3). Data are mean ± SEM. (d) NOX2 mRNA levels at 1 DIV are significantly different from NOX1 mRNA levels at 1 DIV (p < .05, Mann–Whitney U Test, n = 4). Data are mean ± SEM. (e) NOX2 mRNA levels at 3 DIV are significantly different from NOX1 mRNA levels at 3 DIV (p < .05, Mann–Whitney U Test, n = 4). Data are mean ± SEM. NOX = NADPH-oxidase; CGN = cerebellar granule neurons; DIV = days in vitro; ANOVA = analysis of variance.

