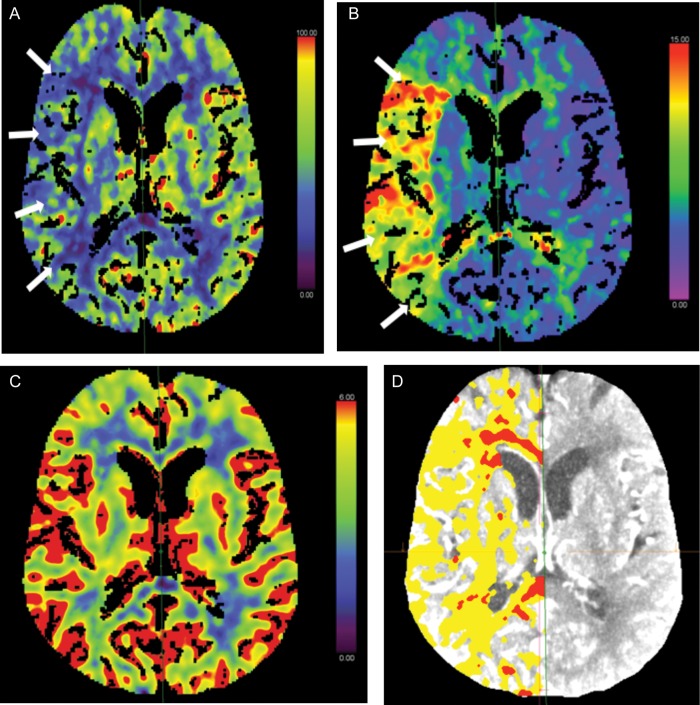
Fig. 1.
Computed Tomography perfusion brain parametric maps. Clockwise from left: (A) CBF map demonstrating a large area of reduced perfusion in the right MCA territory (arrows). (B) MTT map shows prolongation within the right MCA territory (arrows), corresponding with reduced CBF in the same region. (C) CBV map demonstrating no abnormality. This represents a CBV/MTT mismatch or ‘ischaemic penumbra’ (salvageable brain tissue). (D) Map demonstrating region of ‘ischaemic penumbra’ (seen in yellow). This patient would be amenable to acute reperfusion therapy in the form of thrombolysis or thrombectomy. CBF, cerebral blood flow; MCA, middle cerebral artery; MTT, mean transit time; CBV, cerebral blood volume.

