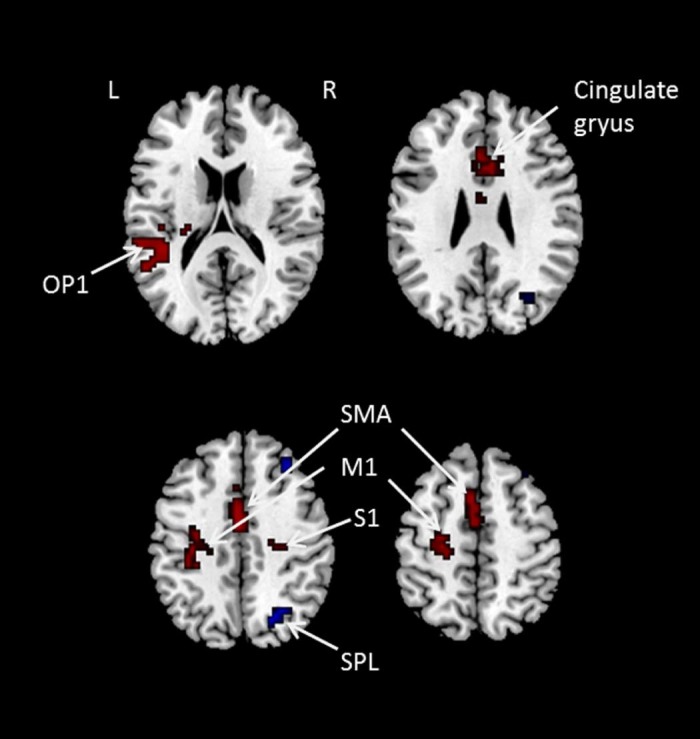
Figure 3.

Brain areas that showed activation and deactivation for left M1 stimulation compared to the vertex stimulation. Red colour indicates activation and blue colour indicates deactivation. S1: primary sensory cortex; SMA: supplementary motor area; OP1: Operculum 1; M1: primary motor cortex; SPL: superior parietal lobe. (For interpretation of the references to colour in this figure legend, the reader is referred to the web version of this article.)
