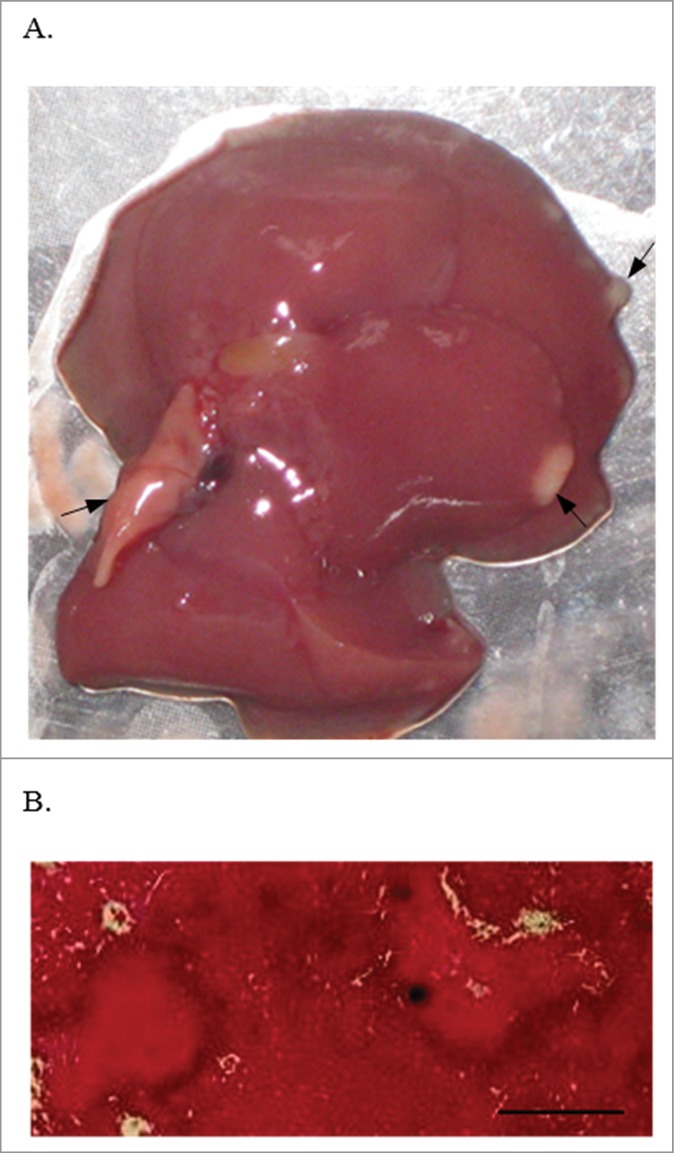
Figure 1.

Liver from a BALB/c mouse on day 3 post intravenous infection with 0.5–1.0 × 10⁹ CFU C. coli 26536. Macroscopic (A) and microscopic examination of haematoxylin and eosin stained liver section (B). Arrows, local tissue necrosis. Bar, 500 µm.
