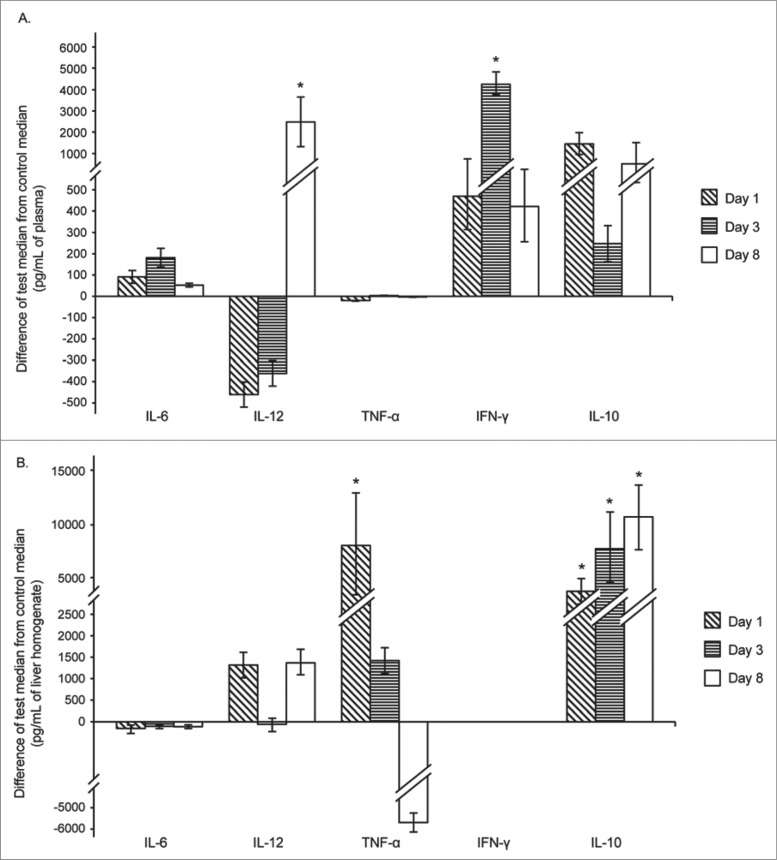
Figure 3.
Differences from the control mice of the median cytokine levels (as indicated) in the plasma (A) and liver (B) of mice infected with C. coli 26536. Median control levels represent zero on the Y axis. Each bar represents the difference between the values for the infected mice minus those for the control mice, at each time point (as indicated) (* P < 0.05). Error bars represent ranges (maximum or minimum test value minus median control value). Cytokine levels in control mice were as follows: (A) plasma: IL-6, 12.83 pg/mL; IL-12, 1529.5 pg/mL; TNF-α, 27.61 pg/mL; IFN-γ, 42.84 pg/mL; IL-10, 37 pg/mL. (B) liver: IL-6, 853 pg/mL; IL-12, 1659.5 pg/mL; TNF-α, 14445 pg/mL; IFN-γ, 3300 pg/mL; IL-10, 1637.8 pg/mL.

