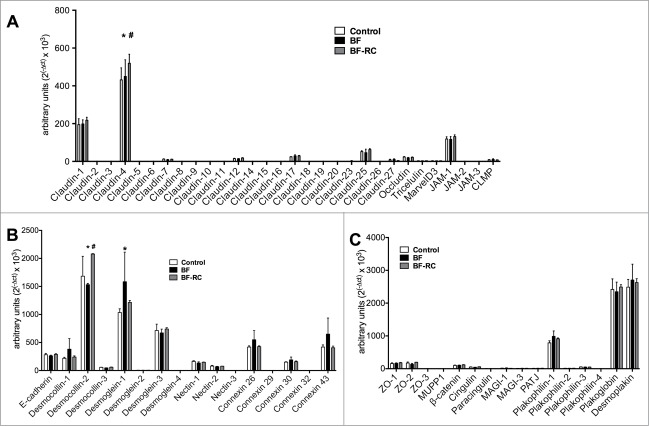
Figure 1.
Junctions gene expression profile in multi-layered gingival epithelial cells cultures, assayed by Taqman low-density array microfluidic card. The cell cultures were challenged for 3 h with BF or BF-RC, and thereafter the gene expression of transmembrane tight junction proteins (A), desmosomes, adherens junctions, and gap junction proteins (B), as well as junctional adaptor proteins (C) were assayed. Bars represent mean values ± SEM from 3 independent cell cultures in each group. Two-way ANOVA was used to calculate the differences between groups. Asterisks (*) represent statistically significant difference compared to the control group, whereas hash tags (#) represent statistically significant difference compared BF (P < 0.05).

