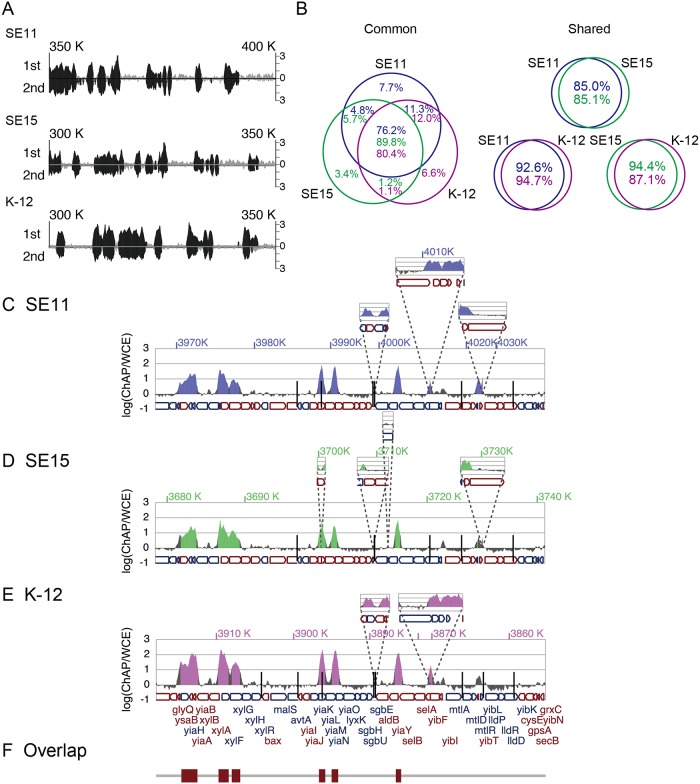
Fig 1. Overlap of H-NS binding regions in the three E. coli strains.
(A) H-NS binding profiles in biological duplicates (1st and 2nd experiment) along the reference genome in the 300K–350K region of E. coli strain K-12 and corresponding regions of stains SE11 (350K–400K) and SE15 (300K–350K). Signal intensity of H-NS binding in the 1st experiment is indicated by upward bars, while that in the 2nd experiment is indicated by downward bars. (B) Venn diagram of H-NS binding regions in the “common” and “shared” segments of the three strains. Percentages in the diagram indicate the proportions of conserved, shared, and unique H-NS binding sequences relative to the total length of H-NS binding regions in the “common” (left panel) and “shared” (right panel) segments of each genome (blue, green, and purple indicate percentages in the SE11, SE15, and K-12 genomes, respectively). (C–E) Typical H-NS binding profiles for “common” segments; the glyS (3,918 kb) through yibN (3,855 kb) region (according to K-12 genome annotation) of SE11 (C), SE15 (D), and K-12 (E) genomes. At the bottom of panel E, the arrangement of coding sequences (CDSs) is shown after connecting “common” segments. The CDS color indicates the direction of translation: red, clockwise; blue, counter clockwise. Shared and specific segments larger than 500 bp are superimposed at the corresponding positions on the connected “common” segments. Positions of smaller shared and specific segments (<500 bp) are indicated by vertical bars. H-NS binding intensities [ChAP / WCE (log10)] at every nucleotide, determined in one of the ChAP-seq experiments performed duplicate (1st experiment), are presented on the vertical axis. Defined H-NS binding regions in each strain are depicted as colored areas in the H-NS binding peaks. (F) Conserved H-NS-bound regions among the three strains are shown as brown rectangles.

