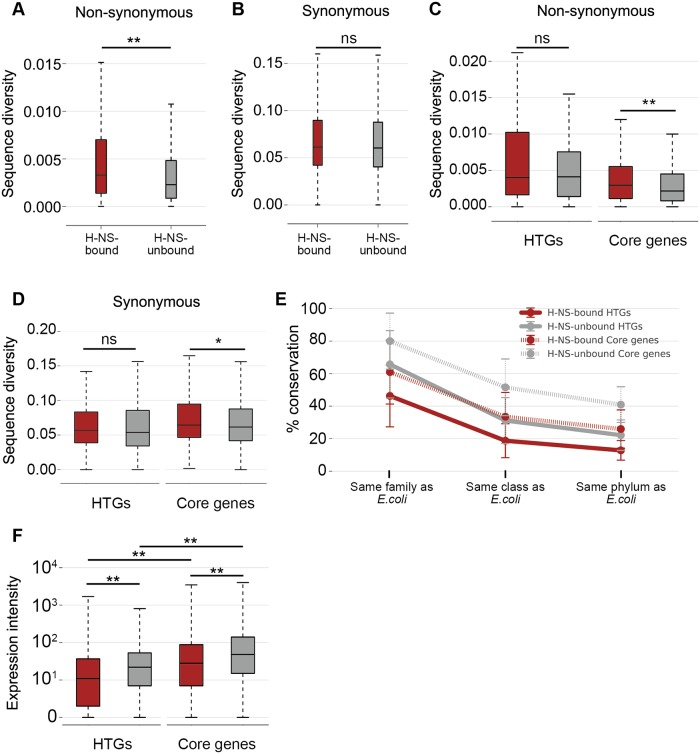
Fig 2. Comparison of sequence diversities of H-NS-bound and -unbound orthologous genes.
Diversity of dN and dS for each orthologous gene cluster was computed by averaging all pairwise evolutionary distances of orthologous genes in E. coli strains. (A–D) Box plots represent the distribution of sequence diversity; shown are the median (horizontal black lines in boxes), the upper and lower quartile values (boxes), and the most extreme data points within 1.5× of the interquartile range (whiskers). (A) Distribution of dN in the H-NS-bound (red; N = 519, median value = 0.0033) and -unbound (gray; N = 2,183, median value = 0.0023) genes. (B) Distribution of dS in the H-NS-bound (red; N = 519, median value = 0.061) and -unbound (gray; N = 2,183, median value = 0.060) genes. (C) Distribution of dN in the H-NS-bound HTGs (red; N = 230, median value = 0.0040), the H-NS-unbound HTGs (gray; N = 271, median value = 0.0041), the H-NS-bound Core genes (red; N = 289, median value = 0.0030), and the H-NS-unbound Core genes (gray; N = 1,912, median value = 0.0022). (D) Distribution of dS in the H-NS-bound HTGs (red; N = 230, median value = 0.057), the H-NS-unbound HTGs (gray; N = 271, median value = 0.054), the H-NS-bound Core genes (red; N = 289, median value = 0.065) and the H-NS-unbound Core genes (gray; N = 1,912, median value = 0.062). (E) Conservation of each class of genes averaged by species belonging to the same family (Enterobacteriaceae) but different genus, in the same class (Gammaproteobacteria) but different family, or in the same phylum (Proteobacteria) but different class as E. coli. Error bars denote standard deviation. Red solid line, H-NS-bound HTGs; gray solid line, H-NS-unbound HTGs, red dotted line, H-NS-bound Core genes; gray dotted line, H-NS-unbound Core genes. (F) Distribution of transcription level of the H-NS-bound HTGs (red; N = 230, median value = 10), the H-NS-unbound HTGs (gray; N = 270, median value = 21), the H-NS-bound Core genes (red; N = 289, median value = 27), and the H-NS-unbound Core genes (gray; N = 1,912, median value = 47). The transcription level of each gene in E. coli K-12 was acquired from RNA-seq data [47] deposited with accession number GSE21341. The gene phnE is missing in the RNA-seq data, and thus we ignored phnE in this analysis. Asterisks indicate the statistical significance of differences in sequence diversity between the H-NS-bound and -unbound genes as assessed with the Wilcoxon rank-sum test (**p < 0.001, *p < 0.05, ns: not significant).

