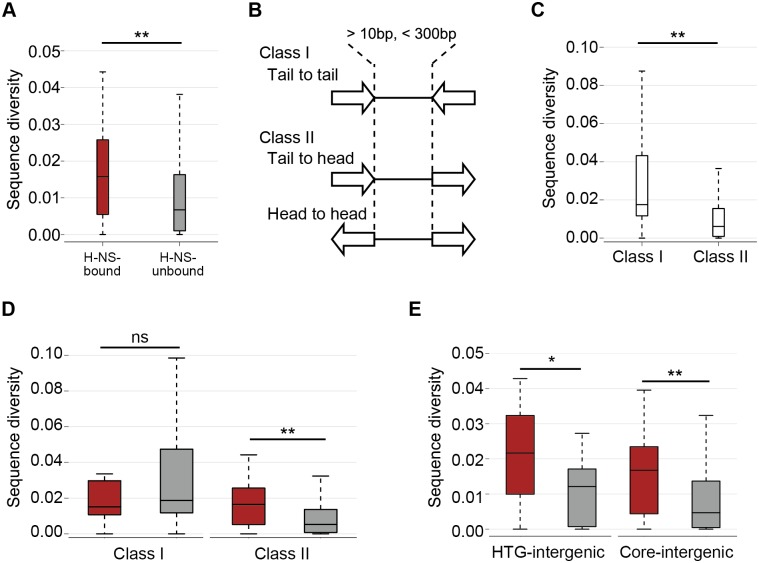
Fig 3. Comparison of sequence diversity between H-NS-bound and -unbound intergenic regions located upstream or downstream of genes.
The diversity of each conserved intergenic region cluster was computed by averaging all pairwise evolutionary distances of the conserved intergenic regions in E. coli strains. Box plots are shown in the same manner as in Fig 2: red, H-NS-bound intergenic regions; gray, H-NS-unbound intergenic regions. (A) Distribution of sequence diversity in the H-NS-bound (red; N = 94, median value = 0.016) and -unbound (gray; N = 609, median value = 0.0067) conserved intergenic regions. (B) Schematic view and definitions of the classes and subclasses of conserved intergenic regions. (C) Sequence diversity of class I (N = 92, median value = 0.018) and class II (N = 611, median value = 0.0061) intergenic regions. (D) Sequence diversity of H-NS-bound (N = 14, median value = 0.015) and -unbound (N = 78, median value = 0.019) class I intergenic regions (left) and of H-NS-bound (N = 80, median value = 0.017) and -unbound (N = 531, median value = 0.0052) class II intergenic regions (right). (E) Sequence diversity of H-NS-bound (N = 24, median value = 0.022) and—unbound (N = 16, median value = 0.012) class II HTG-intergenic regions (left); H-NS-bound (N = 28, median value = 0.017) and -unbound (N = 411, median value = 0.0047) class II Core-intergenic regions (right). The asterisks indicate the statistical significance of the difference between the sequence diversity in the H-NS-bound and -unbound intergenic regions as assessed with the Wilcoxon rank-sum test (**p < 0.001, *p < 0.05, ns: not significant).

