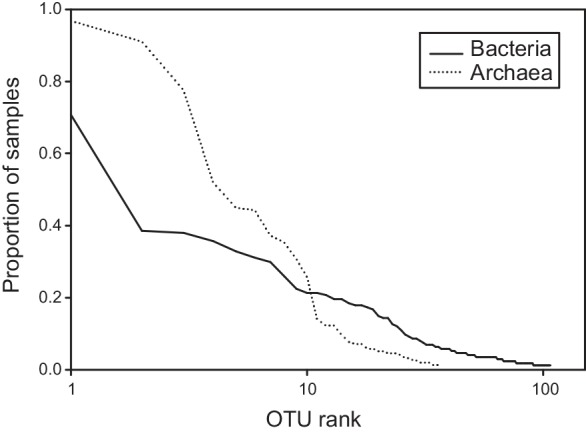
Fig 2. Rank frequency distribution of operational taxonomic units (OTUs) scored for the bacterial and archaeal communities analyzed.

Proportion of samples represents the relative number of samples for which an OTU was detected using community profiling. Note log scale on abscissas representing the 107 and 37 OTUs identified, respectively, for the bacterial and archaeal communities.
