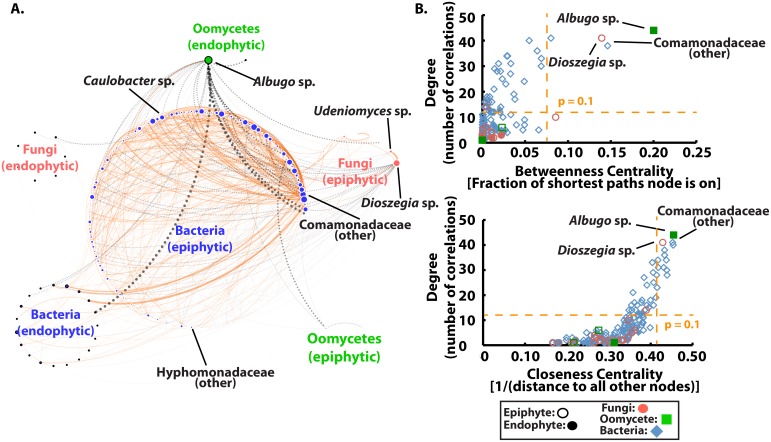
Fig 2. Computational Experiment 3: Inter- and intra-kingdom microbe–microbe interactions affect phyllosphere microbiome structure.
A. A correlation network demonstrates that correlations between microbes within kingdoms tend to be positive (orange solid), while correlations between kingdoms tend to be negative (black dashed). Boldness of lines is related to the strength of the correlation. Correlations were made using samples from both Experiment 1 and Experiment 2. Additional care was taken to ensure correlations were robust (see S1 Text). The network structure was typical of a scale-free network since only a few nodes were highly connected (a power-law fit to the node degree distribution has alpha = −1.072 and r2 = 0.846). B. “Hub” microbes were identified as those which were significantly more central based on all three measurements of centrality. For the network shown in A (based on one of several cutoffs for “good” correlations, see S1 Text), three microbes, Albugo sp., Dioszegia sp., and a genus of Comamonadaceae were identified as “hubs” (yellow line: p = 0.1 based on a log-normal distribution fit). Other genus-level hub microbes indicated in Fig 2A were identified by combining the results of several other correlation cutoffs (see S11 Fig and S7 Table). (S1_Data.xlsx)

