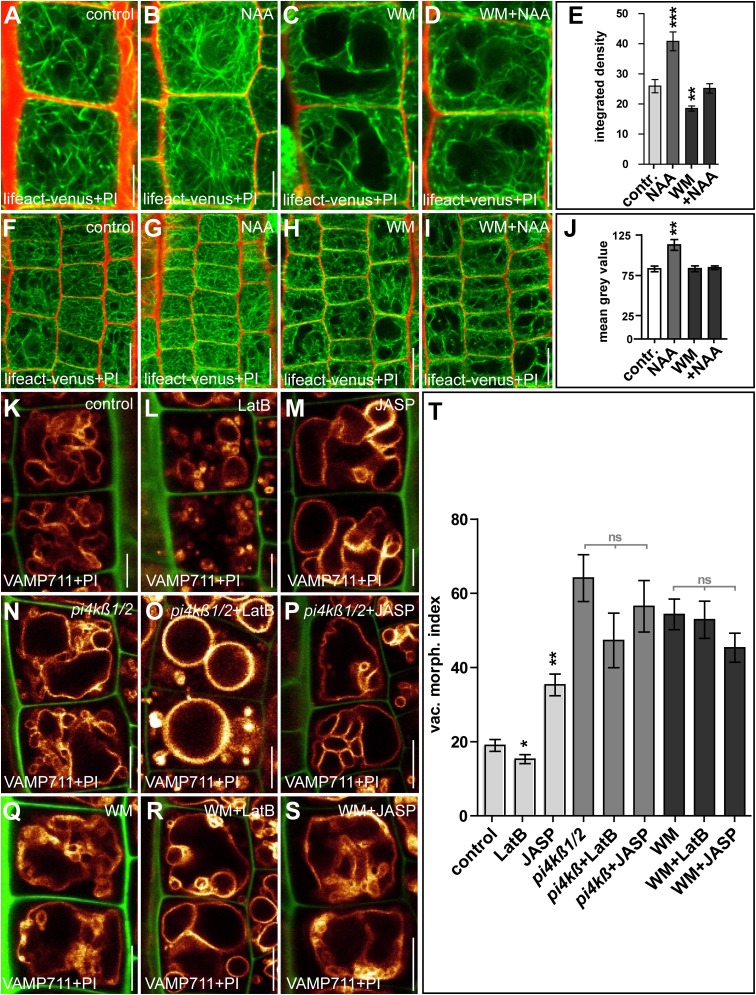
Fig. S6.
Genetic and pharmacological interference with phosphatidylinositols partly abolishes auxin-induced changes in the cytoskeleton and the vacuolar morphology. (A–D) Comparison of seedlings treated with DMSO (control) (A), auxin (NAA; 500 nM, 6 h) (B), or WM; 33 µM, 6 h) (C) or cotreated with WM and NAA (D). (E) Quantification of the integrated density of actin filaments (Lifeact–Venus). **P < 0.01, ***P < 0.001. (F–J) The respective treatments were used to determine the signal intensity of Lifeact–Venus. Compared with the DMSO control (F), only NAA-treated (G), but not seedlings treated with WM (H) or cotreated with WM and NAA (I) showed a significant change (J). **P < 0.01. Lifeact–Venus (green) and PI (red) were used to highlight actin filaments and the cell wall, respectively. (K–M) Changes in vacuolar morphology upon genetic and pharmacological interference with phosphatidylinositols in seedlings treated with DMSO (control) (K), (LatB; 500 nM, 6 h) (L), or JASP (2.5 µM, 6 h) (M). (N–P) The respective treatments of the phosphatidylinositol kinase mutant pi4kß1/2 (N) led to a strongly reduced response to LatB (O) and JASP (P) treatments. (Q–S) Cotreatment with the phosphatidylinositol kinase inhibitor WM (Q) also led to a reduced response to LatB (R) and JASP (S) treatments. YFP-VAMP711 (orange) and PI (green for K–S) were used to highlight the vacuole and the cell wall, respectively. LatB treatment in the pi4kß1/2 mutant and in the presence of WM resulted in more circular vacuoles (compare N to O and Q to R). In K–S, YFP-VAMP711 (orange) and PI (green) were used to highlight the vacuole and the cell wall, respectively. (T) All treatments were quantified using the vacuolar morphology index. Light gray bars indicate statistical evaluation within the pi14β1/2 mutant and within WM treatment. *P < 0.05, **P < 0.01. Note: pi4kß1/2 vacuoles and vacuoles after WM treatment were significantly larger than in wild type (P < 0,001). Light gray bars in T indicate statistical evaluation within the pi14β1/2 mutant and within WM treatment. Data represent means ± SEM (n = 35–70 cells from 6–10 individual seedlings for E and n = 75 meristematic cells from five individual seedlings for J; n = 30 cells from six individual seedlings for T). (Scale bars: A–D and K–S, 5 µm; F–I, 15 µm.)

