Fig. S1.
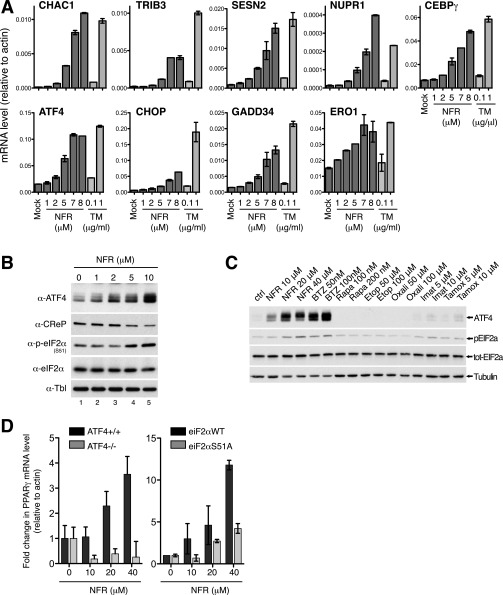
ISR activation by NFR (related to Figs. 4 and 5). (A and B) HeLa cells treated for 14 h with the indicated concentration of NFR or TM were analyzed for expression of indicated genes by real-time PCR relative to β-actin (A) (mean and SEM of technical triplicates of one representative experiment are shown). Samples were also analyzed by WB to monitor ATF4 induction, eIF2α phosphorylation, as well as CReP level (B). Tubulin (Tbl) is used as the loading control. (C) HeLa cells treated for 6 h with the relevant concentration of Nelfinavir (NFR), Bortezomib (BTZ), Rapamycin (Rapa), Etoposide (Eto), Oxaliplatin (Oxali), Imatinib (Imat), and (Z)-4-Hydroxytamoxifen (Tamox) were analyzed by WB to monitor ATF4 induction and eIF2α phosphorylation. Tubulin (Tbl) is used as the loading control. (D) PPARγ is induced by the ISR. ATF4−/− and ATF4+/+ MEFs (Left panel) and eIF2αWT and eIF2α S51A MEFs (Right panel) were treated for 6 h with indicated doses of NFR. PPARγ mRNA level was measured by real-time PCR relative to β-actin (fold change of untreated cells; mean and SEM of technical triplicates of one representative experiment).

