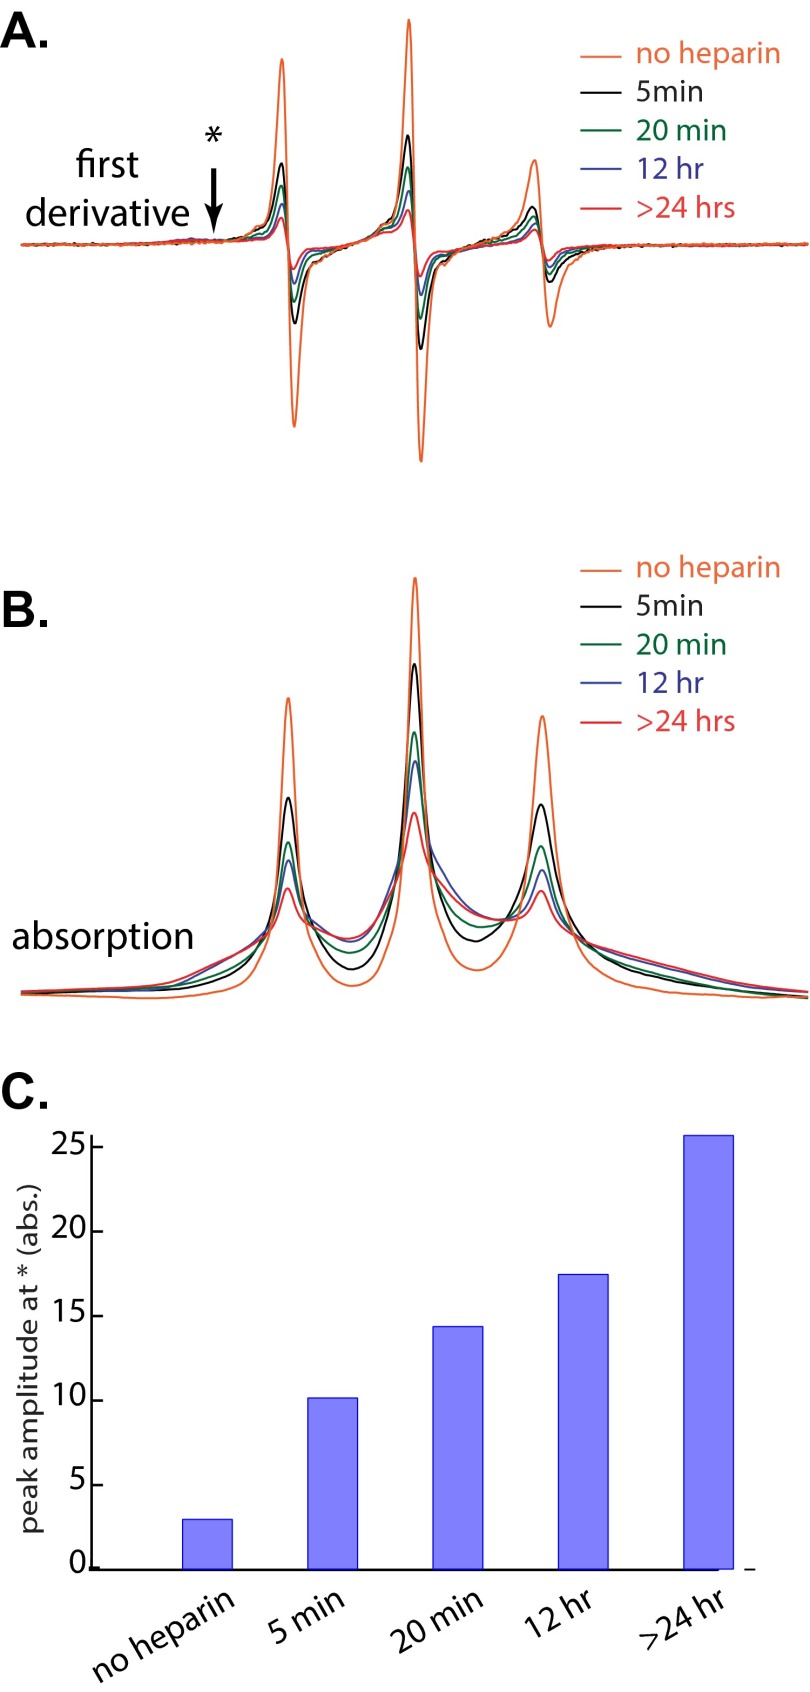
Fig. S4.
Cw ESR spectra in first derivative (A) and absorption (B) modes of 20% R1 spin-labeled Δtau187 (322C) at different aggregation states. (C) Peak amplitude of position * indicated in the first derivative spectra shown as a function of aggregation time. The spectra in A and B are normalized to their double integral values.

