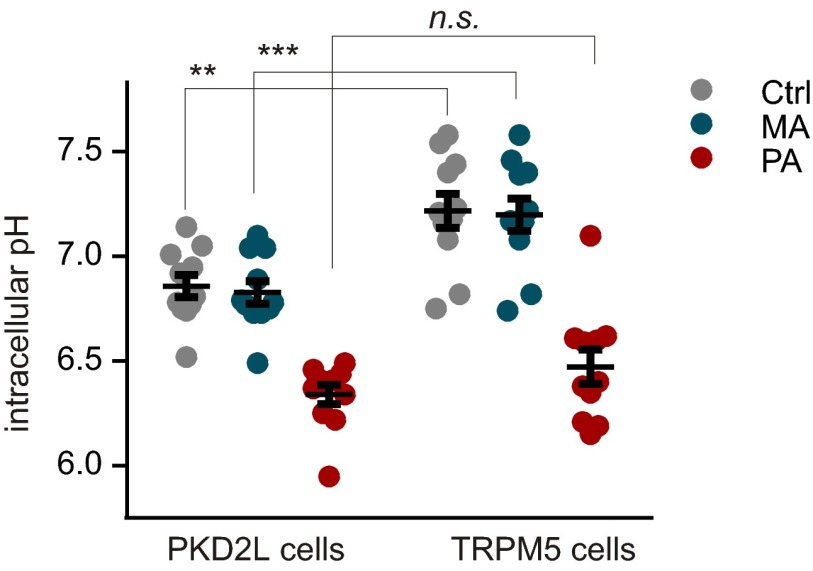
Fig. S6.
The intracellular pH to which TRPM5 cells are acidified by weak acids is similar to that of PKD2L1 cells. Scatter plot of intracellular pH from imaging of cells loaded with pHrodo Red. Cells were sequentially exposed to bath solution (Tyrode’s), 100 mM methanesulfonic acid (MA), and 100 mM propionic acid (PA), all pH 7.4. Intracellular pH was calibrated as described in Methods. By two-way ANOVA, there was a significant difference across the conditions (P < 0.0001) and across cell types (P < 0.01). Post hoc analysis with Sidak’s test corrected for multiple comparisons showed no significant difference between cell types in response to the weak acid, PA (P = 0.43). As previously reported (21), the resting pH of the two cell types was significantly different as was the pH in the presence of MA. Note that MA was used as a control and was not expected to cause a change in pH from resting conditions. **P < 0.01, ***P < 0.001.

