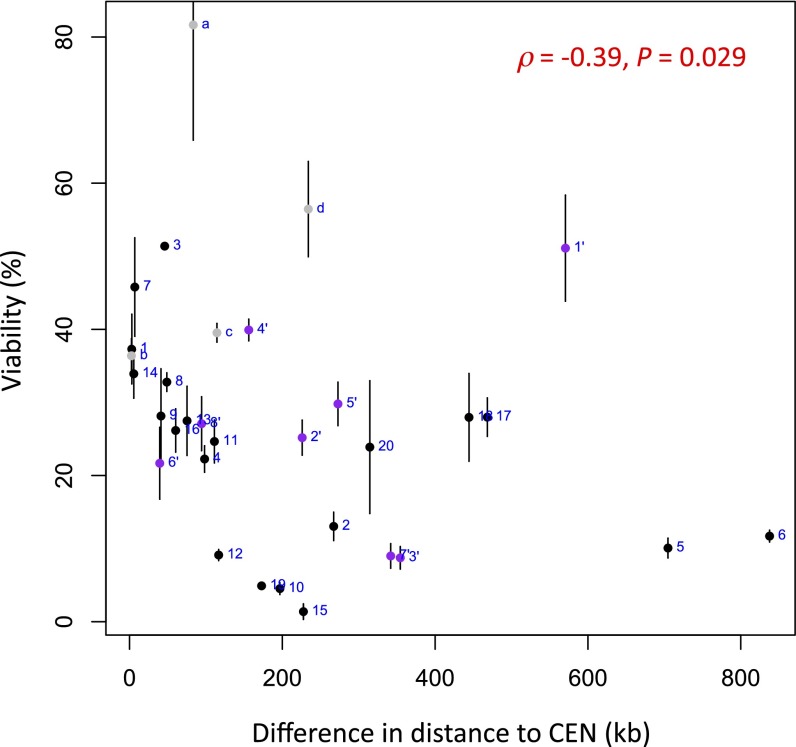
Fig. S4.
Correlation between the viability (%) and the difference in the genomic distance to centromere of DSB and each donor (kb). All 20 interchromosomal loci (loci 1–20, in black), 4 intrachromosomal loci (loci a–d, in gray), and 8 loci in response to Chr2-DSB (loci 1′–8′, in purple) are included in the analysis. Spearman’s rank correlation (ρ = −0.39, P = 0.029) is used in this case because of the obviously nonnormal distribution of samples. No significant correlation is observed when using Pearson’s correlation (r = −0.30, P = 0.099).

