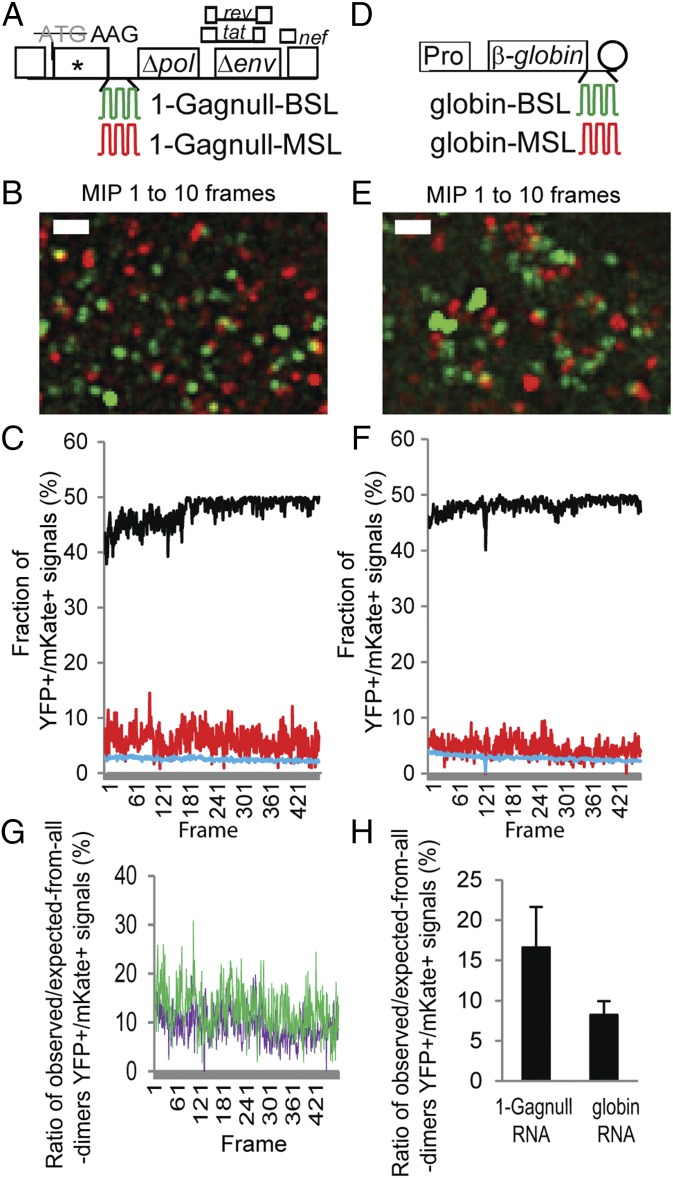
Fig. 2.
Simultaneous detection of two RNAs labeled with YFP and mKate. General structures of the HIV-1 constructs (A) and plasmids expressing human β-globin RNAs (D) that contain stem-loop sequences recognized by BglG (green) or MS2 coat protein (red). Pro, c-fos promoter; rev, regulator of expression of viral proteins; tat, transactivator of transcription. Circle represents polyA signal. For clarity, introns within the β-globin gene are not illustrated. Image of a 10-frame MIP from a movie showing detection of two HIV-1 RNAs (B) and two β-globin RNAs (E) labeled with YFP or mKate. Corresponding movies are shown in Movies S1 and S2, respectively. A LoG filter was applied by using ImageJ. (Scale bar, 2 μm.) Frame-by-frame analyses of the fraction of colocalized YFP and mKate (YFP+/mKate+) signals from two HIV-1 RNAs (C) and two β-globin RNAs (F). Red line represents observed YFP+/mKate+ signals; black line represents expected YFP+/mKate+ signals assuming that all RNAs are randomly assorted dimers; blue line represents expected colocalization of YFP+ and mKate+ signals assuming all RNAs are randomly distributed monomers. (G) Comparison of the ratios of observed/expected-from-all-dimer YFP+/mKate+ signals in HIV-1 RNAs and β-globin RNAs. For each frame, the fraction of the observed YFP+/mKate+ signals was divided by the fraction of the expected YFP+/mKate+ signals assuming that all RNAs are randomly assorted dimers. The ratios of the HIV-1 RNAs from Fig. 2C are shown in green, and the ratios of β-globin RNAs from Fig. 2F are shown in purple. (H) Ratios of observed/expected-from-all-dimer YFP+/mKate+ signals in HIV-1 RNAs and β-globin RNAs. Results from each cell were first analyzed by frame-by-frame comparison, and the mean was calculated. Results from six cells are shown; error bars represent SD.

