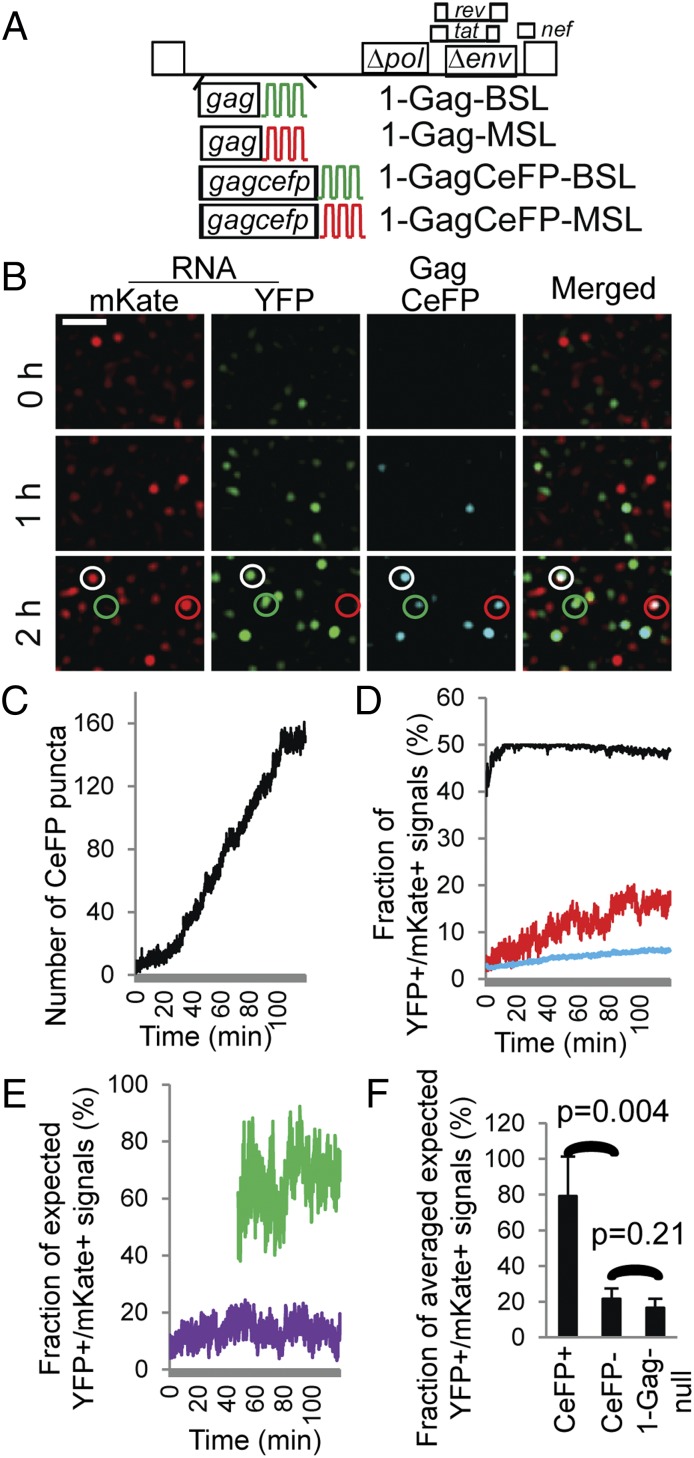
Fig. 3.
The effects of Gag on the colocalization of HIV-1 RNAs labeled with YFP or mKate. (A) General structures of HIV-1 constructs that contain BSL or MSL and express untagged or CeFP-tagged Gag proteins. (B) Representative images showing RNA and Gag signals detected at 0, 1, and 2 h of the experiment. An LoG filter was applied by using ImageJ. (Scale bar, 5 μm.) Red, green, and white circles indicate CeFP puncta that colocalize with mKate+, YFP+, and YFP+/mKate+ RNA signals, respectively. A corresponding movie is shown in Movie S3. (C) Number of CeFP puncta detected in each frame over time. (D) Frame-by-frame analyses of the observed and expected fractions of YFP+/mKate+ signals. Line colors are the same as in Fig. 2C: red, observed; black and blue, expected assuming that all RNAs are dimers and monomers. (E) Comparison of the ratios of observed/expected-from-all-dimer YFP+/mKate+ signals in CeFP+ (green line) and CeFP− (purple line) populations. Results from the same cell are shown in C–E. (F) The effect of detectable Gag on the ratios of observed/expected-from-all-dimer YFP+/mKate+ signals. Results from five cells are shown. HIV-1 1-Gagnull results from Fig. 2H are shown here for comparison; error bars represent SD.

