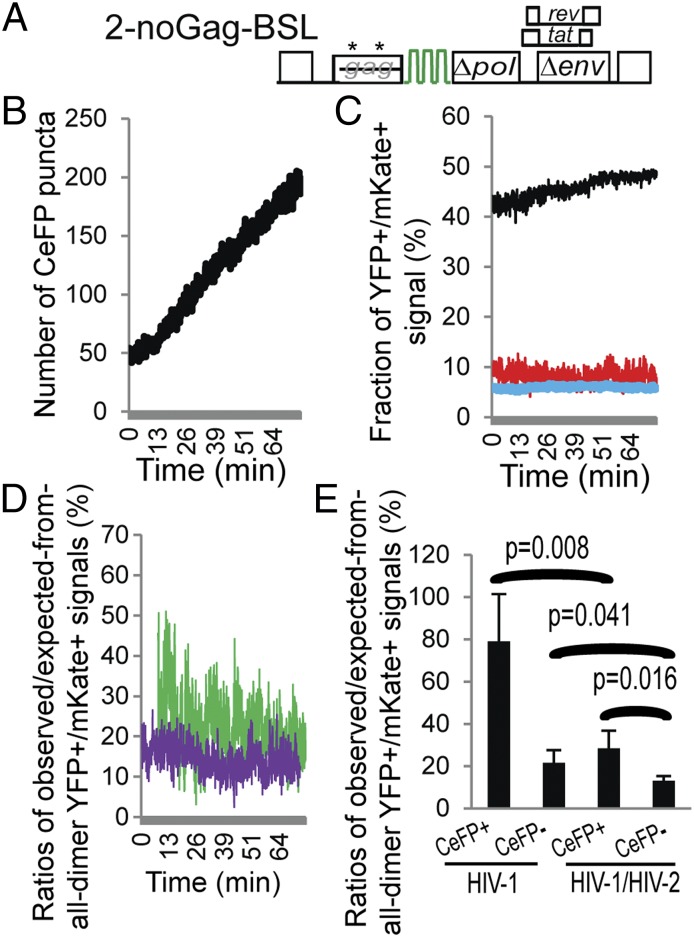
Fig. 4.
Detection of HIV-1 and HIV-2 RNA colocalization in the presence of HIV-1 Gag. (A) General structure of the HIV-2 construct containing BSL with inactivating mutations in gag (asterisks). (B) Number of CeFP puncta detected in each frame over time. (C) Frame-by-frame analyses of the observed and expected fractions of YFP+/mKate+ signals. Line colors are the same as in Fig. 2C: red, observed; black and blue, expected assuming that all RNAs are dimers and monomers. (D) Comparison of the ratios of observed/expected-from-all-dimer YFP+/mKate+ signals in CeFP+ (green line) and CeFP− (purple line) populations. Results from the same cell are shown in B–D. (E) The effect of detectable Gag on the ratios of observed/expected from-all-dimer YFP+/mKate+ signals. Results from five cells are shown. Results from Fig. 3F are shown here for comparison (labeled as HIV-1); error bars represent SD.

