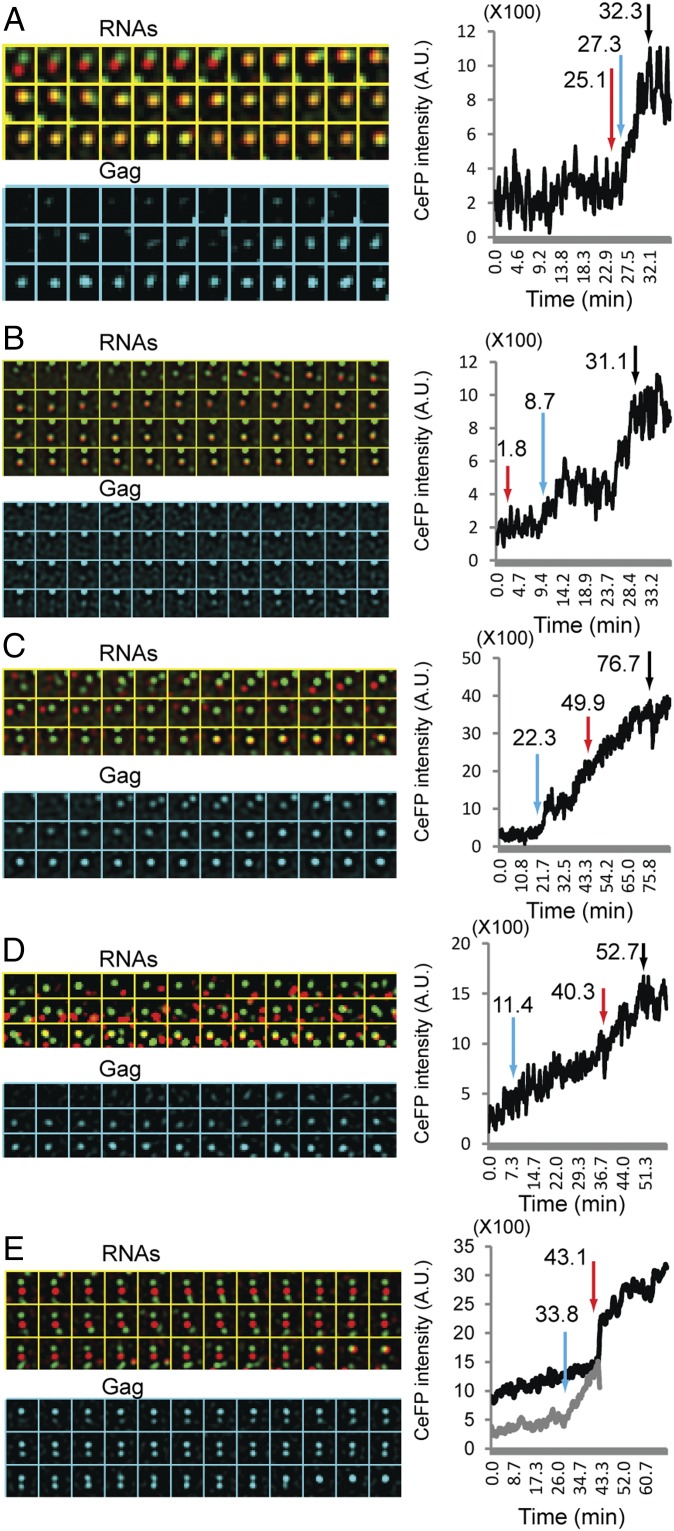
Fig. 5.
HIV-1 RNA–RNA interactions and Gag accumulation on the plasma membrane. Representative events are shown in A–E. In the events shown in A and B, RNA-merging events were detected before the detection of GagCeFP signals; corresponding movies are shown in Movies S4 and S5, respectively. In events shown in C and D, one of the RNAs was colocalized with Gag signal before merging with the other RNA; corresponding movies are shown in Movies S6 and S7, respectively. In events shown in E, both RNA signals were associated with Gag signals before merging; corresponding movies are shown in Movie S8. YFP and mKate signals are shown in panels marked RNAs, whereas CeFP signals are shown in panels marked Gag. (Right) CeFP intensity plots; y axis, CeFP intensity shown in arbitrary units (A.U.). Labels in the y axis are shown in 1/100 (values are ×100); x axis, time in minutes. Red arrows indicate merging of the RNA signals, blue arrows indicate detection of the CeFP signals, and black arrows indicate the plateau of CeFP intensity. An LoG filter (time averaging over three frames) was applied by using ImageJ.

