Fig. 1.
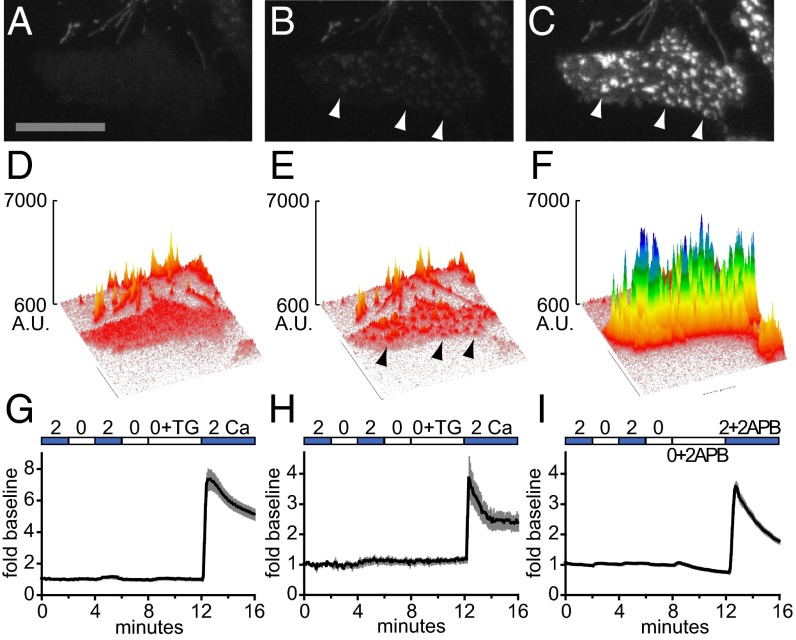
GECI–Orai fusions target to puncta and report calcium influx in transfected cells. (A–C) TIRF micrographs of a HEK 293A cell transiently transfected with G–GECO1–Orai1 and STIM1 and imaged in 2 Ca (A), after 3.5 min in 0 Ca + 2 µM TG (B), and after shift to 2 Ca (C). Arrowheads indicate selected puncta. (Scale bar, 20 µm.) (D–F) Surface plots of the micrographs in A–C, respectively, indicated as arbitrary units (A.U.). Arrowheads indicate the same puncta indicated in B and C. (G and H) Time courses of G–GECO1–Orai1 plotted as mean fold baseline versus time (black lines) in HEK 293A cells (G; n = 26) and resting human T cells (H; n = 9) transiently cotransfected with STIM1 and treated with 2 µM TG. (I) Time course of G–GECO1–Orai3 plotted as mean fold baseline versus time (black line) in transiently transfected HEK 293A cells (n = 24) treated with 100 µM 2-APB. For G–I, gray bars indicate ± SEM.

