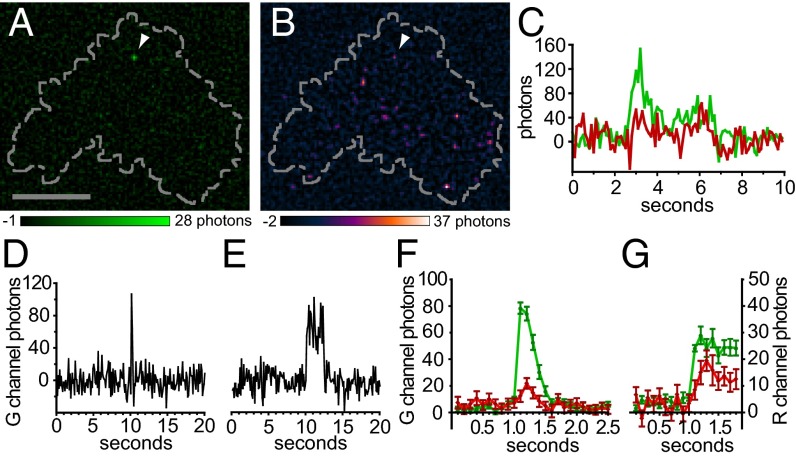
Fig. 2.
Discrete G–GECO1–Orai1 fluorescence transients activated by low-level CAD expression are candidate single-channel responses. (A and B) TIRF images of a HEK 293A cell cotransfected with low levels of G–GECO1–Orai1 (A) and mCherry–CAD (pseudocolored in B). Arrowhead in A indicates a single green fluorescence transient present at the basal surface of the cell (indicated by the dashed line). Note the presence of a fluorescence transient in the corresponding position (arrowhead) in the simultaneously acquired red channel (B). (Scale bar, 10 µm.) (C) Plots of green (G channel) and red (R channel) fluorescence over time for the transient indicated in A and B. (D and E) Example traces of short (flickers, D) and long (pulses, E) fluorescence transients. (F and G) Rises in G–GECO1–Orai1 fluorescence are accompanied by corresponding rises in mCherry–CAD fluorescence. Traces were aligned by the rise in green fluorescence and the mean green and red channel fluorescence intensity was plotted versus time for flickers (F; n = 58) and pulses (G; n = 27). Error bars indicate ± SEM.

